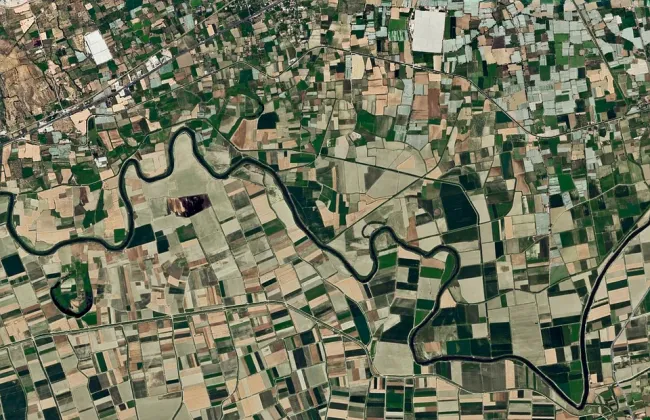
This paper maps the location and cumulative magnitude of the environmental pressures (greenhouse gas emissions, freshwater use, habitat disturbance and nutrient pollution) caused by both aquatic and land-based food production across the globe.
The paper aims to move beyond previous research by:
- Including food types representing 99% of reported global production.
- Using a recently developed method to assess cumulative environmental pressures. The method adds up the total impacts that occur in each 36 km2 “pixel” of land or ocean across the globe. For each pixel, the paper quantifies four environmental impact categories (GHGs, blue freshwater use, nitrogen and phosphorus runoff and volatilisation, and habitat disturbance) occurring due the production of a particular food type. It then repeats the process for all food types that are being produced in that pixel, weighted according to how much of each food is produced, to generate a total environmental pressure for that pixel.
- Exploring where and how much each food type contributes to the total environmental impacts of food production.
The results show that cumulative impacts of food production per “pixel” of area are highly skewed. The 1% of pixels experiencing the highest cumulative impacts (occurring mostly in India, China, the United States, Brazil and Indonesia) account for 39.4% of food’s global cumulative environmental pressures, partly because they are producing so much food - they generate 30.9% of food (by weight). The vast majority of environmental pressures (92.5%) occur in just 10% of pixels. Most pressures occur on land (89.9% of the global total). The pressures that occur at sea (9.9%) or in freshwater systems (0.2%) are disproportionate to the fraction of food and feed provided by aquatic ecosystems (1.1%). Habitat disturbance (e.g. from bottom trawling) dominates the pressures for several seafood categories.
Image: Figure 2a, Halpern et al. Proportion of global cumulative environmental pressure (in millionths) per pixel from all foods representing the combined pressure from disturbance. Pixels coloured red show the top 1% of impacts.
The image above shows the geographical distribution of the four impact categories combined. When each impact category is considered separately, the maps look slightly different (see the full image) because not all impacts occur at the same level of intensity in each place. However, there is some overlap between the spatial spread of each of the four impact categories - for example across much of the north of India, where many pixels are in the top 1% for all four impact categories.
The paper also ranks total global cumulative environmental pressures by food type - shown below. Note that the values shown here are the per-unit impacts multiplied by the quantity of each food produced - they are not a ranking of the impacts per kg of food type product. Note also that the horizontal scales are different in each subsection of the graph. Pig meat, cattle meat, rice and wheat crops generate the highest total impacts across the globe. Impacts from crops used as animal feed are attributed to the livestock impacts, and to avoid double counting of impacts from crop production, the impacts for crops are only for the portion used primarily as human food.
Image: Figure 5, Halpern et al. Proportion of total global cumulative environmental pressure for each food type (bar length), broken down by classes of pressure (components of each bar).
The authors also map the environmental efficiency of food production, i.e. the cumulative impacts across all four impact categories divided by the total production of a given food type within a geographical area. They find high variation in efficiencies between both food types and geographically. For crops, when comparing the 10th and 90th percentiles between countries, there is an average seven-fold difference in environmental efficiency. For example, because farmers in the United States use technologies that can reduce emissions and increase yields, US production of soy is 2.4 times more environmentally efficient than in India. Similarly, Brazil is 1.9 times less environmentally efficient than Russia in the harvest of demersal fish, partly due to the use of different fishing equipment.
The authors conclude that the identification of spatial overlaps in the environmental pressures from food production can help to inform policies that may have multiple co-benefits, i.e. by reducing impacts in several categories at once.
Abstract
Feeding humanity puts enormous environmental pressure on our planet. These pressures are unequally distributed, yet we have piecemeal knowledge of how they accumulate across marine, freshwater and terrestrial systems. Here we present global geospatial analyses detailing greenhouse gas emissions, freshwater use, habitat disturbance and nutrient pollution generated by 99% of total reported production of aquatic and terrestrial foods in 2017. We further rescale and combine these four pressures to map the estimated cumulative pressure, or ‘footprint’, of food production. On land, we find five countries contribute nearly half of food’s cumulative footprint. Aquatic systems produce only 1.1% of food but 9.9% of the global footprint. Which pressures drive these footprints vary substantially by food and country. Importantly, the cumulative pressure per unit of food production (efficiency) varies spatially for each food type such that rankings of foods by efficiency differ sharply among countries. These disparities provide the foundation for efforts to steer consumption towards lower-impact foods and ultimately the system-wide restructuring essential for sustainably feeding humanity.
Reference
Halpern, B.S., Frazier, M., Verstaen, J., Rayner, P.E., Clawson, G., Blanchard, J.L., Cottrell, R.S., Froehlich, H.E., Gephart, J.A., Jacobsen, N.S. and Kuempel, C.D., 2022. The environmental footprint of global food production. Nature Sustainability, pp.1-13.
Read the full paper here or here (PDF link). See also the TABLE explainer Food systems and greenhouse gas emissions.
Comments (0)