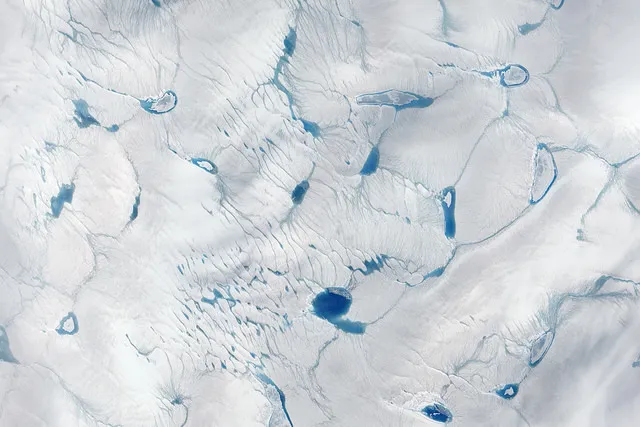
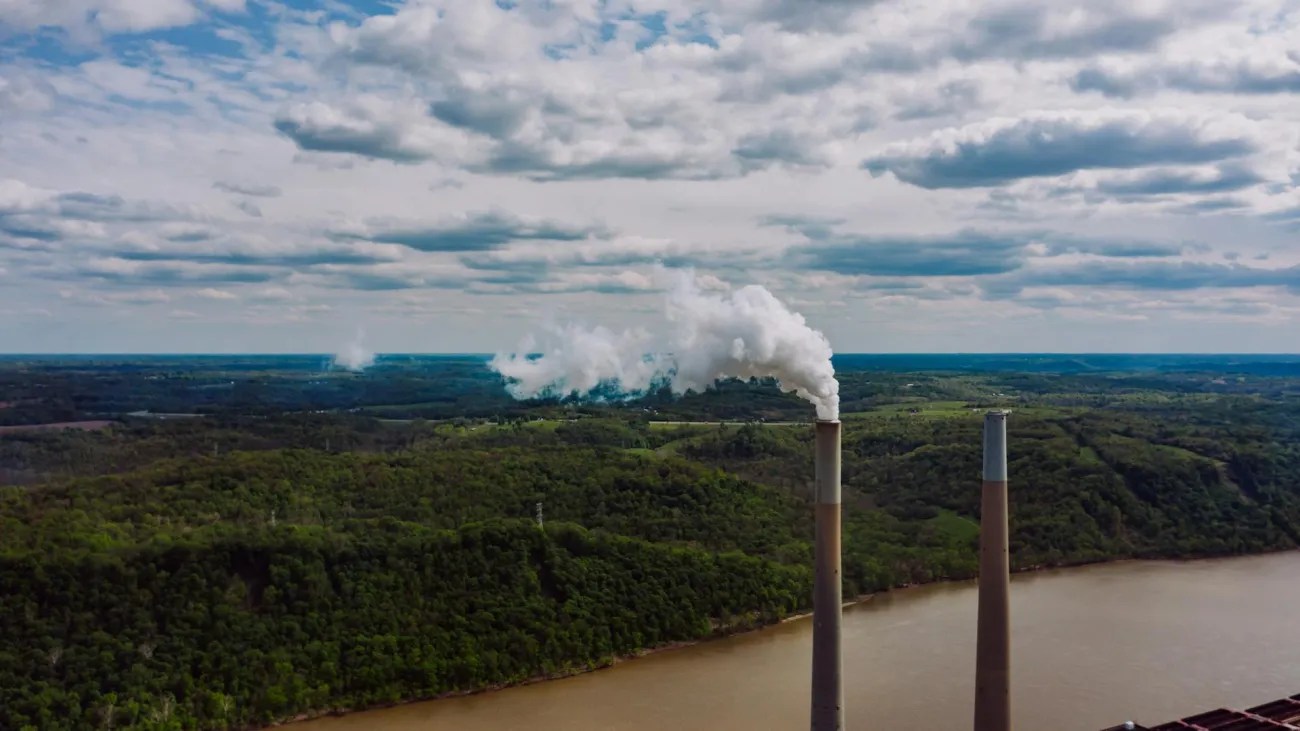
A new resource has been created by the Carbon Brief, which brings together data from a number of indicators that show the effects of climate change, showing trends in our climate, atmosphere, oceans, and the cryosphere (ice)
Image

Many of the graphics are interactive allowing data to be filtered by its source, or year, or other variables.
To look at the dashboard see here.
THEMES
PUBLISHED
21 Jun 2017


Comments (0)