Future demand for food and for land is set to grow. A key question is therefore: how can we most productively use land for food, in order balance the multiple competing demands for the ecosystem services it provides? One way this has been investigated previously is by looking at crop yields and how to increase them. Another way, focussing instead on the consumption side, has looked at the metric of dietary land footprint.
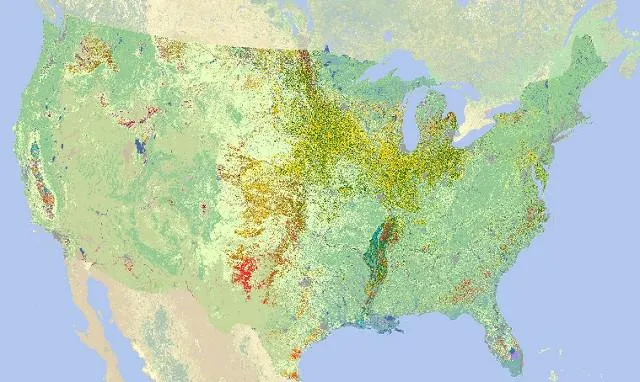
This study presents an example of another way to think about the productivity of land use for food production, by developing the concept of carrying capacity (people fed per unit area) which links assumptions about land’s productive capacity to assumptions about population scale dietary choices and their embodied land use. In doing so, it reframes the goal of productivity to include both food supply and diets together, asking, how many people can be healthily fed using a given land base? This is then applied to the case of all US agricultural land. In particular, ten dietary scenarios with differing levels of meat content were modelled, to isolate the effect of dietary composition on carrying capacity.
The results show that the number of people that could be fed using the US agricultural land base, varies between 402-807 million people, depending on dietary pattern. This reveals that even in the case of the current US dietary pattern, the US agricultural land base could support a population 30% greater than the US population in 2010 (almost 309 million people), which could, via dietary change (to reduce land demand per capita), be expanded to make a considerable contribution to global food security.
US carrying capacity (number of people who could potentially be fed) was found to increase as the quantity of meat in the diet decreased, peaking for a vegetarian diet. Perhaps counterintuitively, despite having a similar land footprint to a vegetarian diet (0.12 ha vs 0.13 ha), the carrying capacity of a vegan diet was, in fact, 9% lower (although still 238% greater than that required for the 2010 US population). The reason for this difference is that in the vegan scenario as for the vegetarian scenario, land available for crop cultivation was used maximally for food production, but unlike in the vegetarian scenario, other land available for pasture or animal feed production remained unutilised for food production. This means that the overall amount of food that could be produced in the vegan scenario was lower than in the vegetarian scenario.
This highlights the role that livestock can play in adding to the total food supply and thereby food security, when not in competition for land able to produce human-edible food. Otherwise, if these available calories are not utilised, to feed the same total amount of people, relatively more cropland would be required for a vegan diet.
The analysis was based on a biophysical accounting model (‘Foodprint model’), which, working backwards from each dietary scenario (described in the table below), calculated the associated commodity needs and consequent demand for land per capita, then compared this demand to actual land availability, in order to determine the overall carrying capacity resulting from each diet. The modelling treated the United States as a closed system, only considering its agricultural land base, with no indirect land use through trade included. The scenarios focused solely on differences in food consumption patterns; parameters for food losses and waste, processing conversions, livestock feed needs, crop yields, land availability, and land suitability were held constant

An important feature of this analysis was that agricultural land was subdivided into 3 separate categories: permanent grazing land (299 million ha), cultivated cropland (95 million ha), and perennial cropland (39 million ha) used for animal feed or fodder, as part of necessary crop rotation systems to maintain fertility. The land footprint for each dietary scenario was also subdivided, according to the embodied demand for each of these three pools, as shown in the graph below. The graph also shows the decreasing trend in land footprint with decreasing meat content, most of which is accounted for by reduced usage of grazing and perennial cropland, rather than cultivated cropland.

When calculating the carrying capacity, the numbers of people that could be fed by a specific dietary scenario was limited by the availability of each category of agricultural land, relative to demand for each land type from diets. In practice, this meant that carrying capacity was effectively limited by the availability of cultivated cropland. For all diets from 60% omnivorous through to vegan, 100% of US cultivated cropland is used. Given this constraint, those diets with the lowest footprint were able to feed more people on available land. The carrying capacity for a selection of the modelled diets and their comparison to the 2010 US population are given in the table below.
|
Dietary Scenario |
Carrying Capacity (millions) |
% 2010 US Population |
|
Current American Diet |
402 |
130% |
|
100% Omnivorous |
467 |
151% |
|
60% Omnivorous |
669 |
217% |
|
20% Omnivorous |
769 |
249% |
|
Vegetarian (no eggs) |
807 |
261% |
|
Vegan |
735 |
238% |

The authors emphasise that food provision is not the only important function of land use and that other ecosystem services should also be considered. The greenhouse gas emissions associated with the different diets are not calculated either. Furthermore, the analysis only considered biophysical constraints and so does not account for economic, political, or structural barriers to changing diets and the necessary changes to agricultural systems needed to supply them. The authors also highlight the need for more work to understand the sensitivity of the modelling to parameters such as crop yields and food waste, as well as to input data such as variability in dietary composition (e.g. types of meat eaten within each diet).
Nevertheless, future research addressing these caveats is unlikely to shift the major finding of this study, that dietary composition matters, when it comes to finding effective solutions to future land-use competition for food, fuel, and other ecosystem services.
Abstract
Strategies for environmental sustainability and global food security must account for dietary change. Using a biophysical simulation model we calculated human carrying capacity under ten diet scenarios. The scenarios included two reference diets based on actual consumption and eight “Healthy Diet” scenarios that complied with nutritional recommendations but varied in the level of meat content. We considered the U.S. agricultural land base and accounted for losses, processing conversions, livestock feed needs, suitability of land for crops or grazing, and land productivity. Annual per capita land requirements ranged from 0.13 to 1.08 ha person-1 year-1 across the ten diet scenarios. Carrying capacity varied from 402 to 807 million persons; 1.3 to 2.6 times the 2010 U.S. population. Carrying capacity was generally higher for scenarios with less meat and highest for the lacto-vegetarian diet. However, the carrying capacity of the vegan diet was lower than two of the healthy omnivore diet scenarios. Sensitivity analysis showed that carrying capacity estimates were highly influenced by starting assumptions about the proportion of cropland available for cultivated cropping. Population level dietary change can contribute substantially to meeting future food needs, though ongoing agricultural research and sustainable management practices are still needed to assure sufficient production levels.
Citation
Peters, C.J., Picardy, J., Darrouzet-Nardi, A.F., Wilkins, J.L., Griffin, T.S. and Fick, G.W. (2016). Carrying capacity of US agricultural land: Ten diet scenarios. Elementa: Science of the Anthropocene, 4(1), p.000116.
Read the full paper here (open access) and a previous related study by the authors here (paywall). Also see this study here (open access), which explores the land-use efficiency contribution that livestock can make to food security, and this study here (open access), which found that for the Netherlands, 12% was the optimal level of dietary protein from animals in order to ensure that non-human edible food was not wasted, while at the same time, human edible crops were not fed to livestock.
For further coverage in the media see an article in Quartz here and another in Ensia here.
You can read related research by browsing the following categories of our research library: Consumer stage; Primary production: agriculture; Meat, eggs and alternatives; Land; Consumption and diets; Food security and nutrition; North America.
And through the keyword categories: Consumption and production trends; Dietary trends; Food consumption; Grazing & land use; Land footprint; Land-sparing vs. land-sharing; Land use & land use change; Multicriteria analysis; Vegetarianism/veganism.
Comments (0)