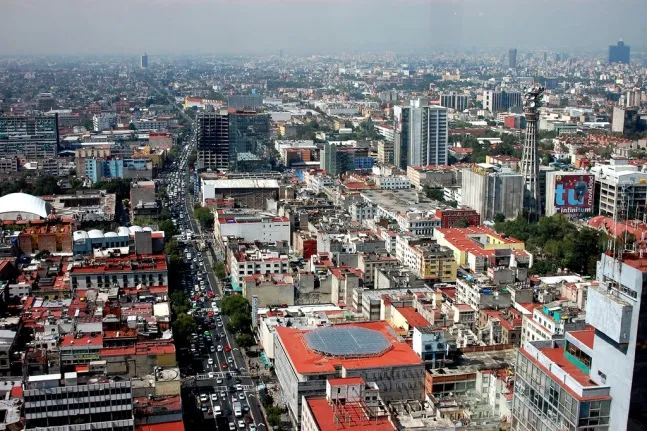
This paper provides the first estimate of energy and material flows in the world’s 27 megacities (cities with over 10 million inhabitants). These megacities are home to 6.7 per cent of the world's population, but consume 9.3 per cent of global electricity and produce 12.6 per cent of global waste. The authors establish statistical relations for energy use, transport, water use, waste and so forth and factors such as average temperature, urban form, level and type of economic activity, and population growth. This allows the researchers to evaluate which cities have high versus low levels of consumption and which ones make efficient use of resources.

Its conclusions are that “energy and material flows vary considerably among megacities. Rates between the lowest- and highest-consuming megacities differ by a factor of 28 for energy per capita, 23 for water per capita, 19 for waste production per capita, 35 for total steel consumption, and 6 for total cement. Some megacities may need to increase such resource flows to provide access to basic services for all citizens, whereas others may aim to decrease energy and material flows to reduce associated environmental impacts. Policies that aim at resource efficiency can be successful, but the energy and material flows of megacities also are influenced by HDD [heating degree days – i.e. cold weather], urban form, economic activity, and scale effects. Our analysis has provided previously unidentified insights into the relation between electricity consumption and urban form. The close correlation between per capita electricity use and urbanized area per capita at the macroscale is a consequence of the microscale relationship between electricity use and building gross floor area. Cities that have higher urbanized area per person have more building floor area per person.”
Abstract
Understanding the drivers of energy and material flows of cities is important for addressing global environmental challenges. Accessing, sharing, and managing energy and material resources is particularly critical for megacities, which face enormous social stresses because of their sheer size and complexity. Here we quantify the energy and material flows through the world’s 27 megacities with populations greater than 10 million people as of 2010. Collectively the resource flows through megacities are largely consistent with scaling laws established in the emerging science of cities. Correlations are established for electricity consumption, heating and industrial fuel use, ground transportation energy use, water consumption, waste generation, and steel production in terms of heating-degree-days, urban form, economic activity, and population growth. The results help identify megacities exhibiting high and low levels of consumption and those making efficient use of resources. The correlation between per capita electricity use and urbanized area per capita is shown to be a consequence of gross building floor area per capita, which is found to increase for lower-density cities. Many of the megacities are growing rapidly in population but are growing even faster in terms of gross domestic product (GDP) and energy use. In the decade from 2001–2011, electricity use and ground transportation fuel use in megacities grew at approximately half the rate of GDP growth.
Citation
Kennedy, C.A., Stewart, I., Facchini, A., Cersosimo, I., Mele, R., Chen, B., Uda, M., Kansal, A., Chiu,A., Kim, K., Dubeux, C., Lebre La Rovere, E., Cunha, B., Pincetl, S., Keirstead, S., Barles, S., Pusaka, S., Gunawan, J., Adegbile, M., Nazariha,M., Hoque, S., Marcotullio, P.J., González Otharán, F., Genena, T., Ibrahim, N., Farooqui, R., Cervantes, G., Duran Sahin, A., (2015) Energy and material flows of megacities, PNAS, DOI:10.1073/pnas.1504315112
Read the full paper here and see further coverage in Science daily here.
If you found this paper interesting, note also the C40 initiative. It is a network of over 70 of the world’s megacities who have committed to taking action on climate change. It would be interesting to compare membership of this network with the individual city results from this paper (see the supporting information accompanying the full paper) although it would probably not be easy to draw meaningful conclusions.
In our research library you can find more resources on food sustainability in urban contexts.


Comments (0)