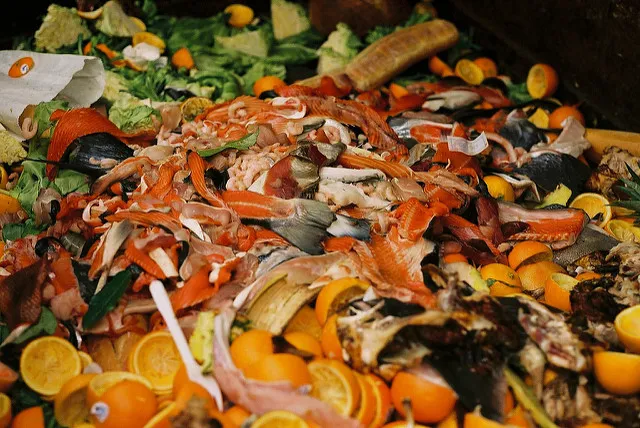
As the global population grows and food consumption patterns shift towards more resource intensive foods, food loss and waste (FLW) is becoming a topic of increasing importance due to its impact on future food availability and - via the greenhouse gas emissions embodied in its production - on climate change.

This study makes a contribution to understanding the global food waste problem and its climate impacts by quantifying, disaggregated trends in global FLW and their associated greenhouse gas emissions between 1961 and 2011. In doing so, it shows where losses have tended to occur over time by country, commodity, and food chain stage (as shown below), thereby making it possible to visualise and prioritise where best to apply mitigation effort, so as to increase the efficiency of the food system.

The results document a large increase in FLW globally as well as a large increase in associated greenhouse gas emissions. Over the period studied, global FLW grew threefold (536 Mt to 1626 Mt) as did FLW-related greenhouse gas emissions (680 Mt to 2.2 Gt CO2e). The findings go on to report trends at lower levels of aggregation.
To enable this disaggregation a ‘bottom up’ approach was used, starting with a country-level model used to calculate food produce inputs, losses, and outputs at each food chain stage, based on data from the FAO’ food balance sheet database. Only food intended for human consumption was included. For each commodity, loss factors at each food chain stage as well as life cycle analysis emission factors (up to farm gate level) were obtained through a meta-analysis of the peer-reviewed literature. The patchy quality of available loss and emissions factor data for individual countries and commodities, was a key limitation for this and future studies. Because of this, the estimation of loss and emission factors was limited to the resolution of regional groups of countries, with these factors then applied to the country level datasets on net food consumption within these regional groups (Europe; North America & Oceania; Industrialised Asia; North Africa, West & Central Asia; Latin America; sub-Saharan Africa; South & South-East Asia).
While every region contributed to overall growth in per capita FLW and related greenhouse gas emissions, regional trends in FLW and related emissions differed strongly. Absolute and per capita food loss and waste has grown rapidly in developing countries, such that they are now the biggest overall contributors, accounting for 75% of global FLW in 2011, rising from 25% in 1961. Indeed, according to the study, growth in total global FLW-related emissions since the early 1990s has been largely driven by developing nations. Despite this, per capita levels of FLW and related GHG emissions remain higher in developed countries, especially in North America and Oceania; although, as shown in the figure below, developing regions have been gaining ground due to low FLW growth rates in North America & Oceania (1.3%) and especially in Europe (0.6%). Notably, per capita FLW-related GHG emissions for Latin America have overtaken those in Europe in the last decade

By commodity, fruits and vegetable FLW increased markedly over the period, growing from 30% of globally wasted food (by mass) in 1961 to make up 42% in 2011. When combined with cereals, and roots & tubers – these commodities accounted for around 80% of FLW by mass across the past five decades. However, due to their relatively low emissions footprints, these commodities represent only 40% of FLW-associated greenhouse gas emissions. This contrasted strongly with meat, which makes up just 3-4% of global FLW by mass, but accounted for 34-38% of global FLW-related greenhouse gas emissions over the period analysed.
The authors note that increases in FLW-related emissions show no indication of slowing at the global level and that the trend for developing countries to produce ever-greater proportions of global FLW and its associated GHG emissions looks likely to continue. If, as estimated by another recent study (linked to below) expected population growth and dietary trends towards diets higher in meat continue, this could lead to a further 160–260% increase in FLW by 2050, which if applied to the present study’s results, would equate to FLW-related greenhouse gas emissions in the order of 5.7–7.9 Gt CO2e in 2050 – roughly equivalent to to all GHG emissions of the U.S. in 2011. Consequently, the authors highlight the pressing need for efficiency improvements in the global food system, to stop future growth in FLW-related emissions.
When interpreting the results of this study, some important caveats should be kept in mind. Waste volumes at all food chain stages were quantified in this study, but those greenhouse gas emissions arising at the production stage were estimated and then used as the basis for allocation at later stages. Also, emissions factors in this study are applied to the full weight of FLW rather than to just the edible parts or that not recovered or used for other purposes. Additionally, greenhouse gas emissions are not the only socially relevant issue linked to food waste. Loss of calories and nutrients are equally important to understand, but not considered by this study.
Abstract
Research on loss & waste of food meant for human consumption (FLW) and its environmental impact typically focuses on a single or small number of commodities in a specific location and point in time. However, it is unclear how trends in global FLW and potential for climate impact have evolved. Here, by utilising the Food and Agriculture Organization's food balance sheet data, we expand upon existing literature. Firstly, we provide a differentiated (by commodity, country and supply chain stage) bottom-up approach; secondly, we conduct a 50- year longitudinal analysis of global FLW and its production-phase greenhouse gas (GHG) emissions; and thirdly, we trace food wastage and its associated emissions through the entire food supply chain. Between 1961 And 2011 the annual amount of FLW by mass grew a factor of three – from 540 Mt to 1.6 Gt; associated production-phase (GHG) emissions more than tripled (from 680 Mt to 2.2 GtCO2e). A44% increase in global average per capita FLW emissions was also identified – from 225 kg CO2e in 1961 to 323 kg CO2e in 2011. The regional weighting within this global average changing markedly over time; in 1961 developed countries accounted for 48% of FLW and less than a quarter (24%) in 2011. The largest increases in FLW-associated GHG emissions were from developing economies, specifically China and Latin America – primarily from increasing losses in fruit and vegetables. Over the period examined, cumulatively such emissions added almost 68 Gt CO2e to the atmospheric GHG stock; an amount the rough equivalent of two years of emissions from all anthropogenic sources at present rates. Building up from the most granular data available, this study highlights the growth in the climate burden of FLW emissions, and thus the need to improve efficiency in food supply chains to mitigate future emissions.
Citation
Porter, S.D., Reay, D.S., Higgins, P. and Bomberg, E. (2016). A half-century of production-phase greenhouse gas emissions from food loss & waste in the global food supply chain. Science of The Total Environment. Doi: http://dx.doi.org/10.1016/j.scitotenv.2016.07.041
Read the full article here (paywall). Also see this related study here.
You can read related research by browsing the following categories of our research library: Waste and resource use; Consumption and diets; Climate change: Mitigation; Life cycle analysis; Global.
And through the keyword categories: Waste; GHG emission trends; Food waste; Agricultural losses.


Comments (0)