
Journal articles
A global map of the conflict between agriculture and conservation
This study aims to provide a comprehensive global assessment of where food and agricultural production conflicts with biodiversity conservation, and the products and countries that contribute the most to these trends. Spatial models of farming and conservation priority areas were used to estimate how the production and consumption of 48 agricultural commodities across 197 countries conflict with the conservation of 7,143 species.

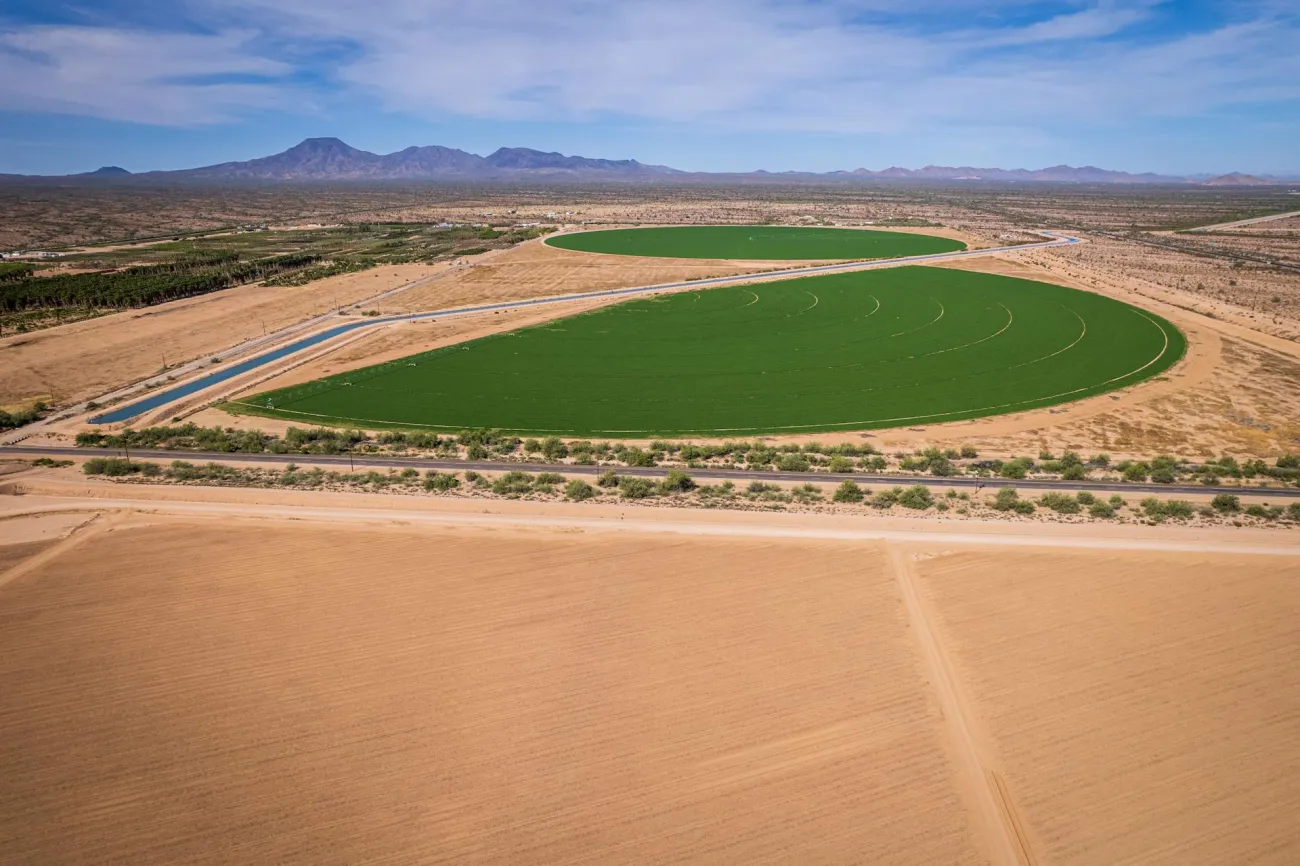
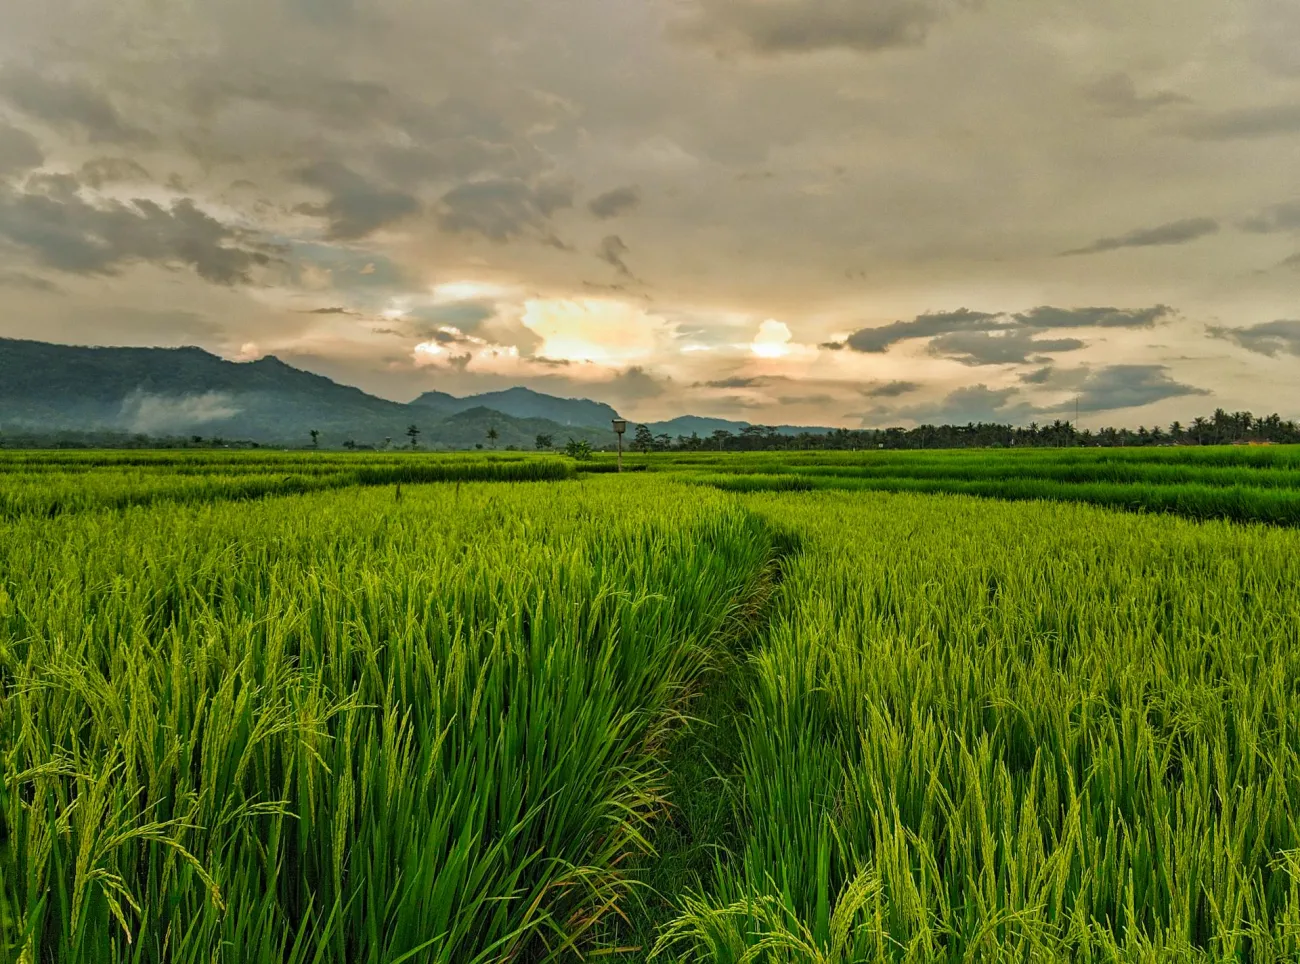
Globally, over three quarters of agriculture production was found to occur in sites of medium-very high conservation priority. Moreover, only 5 out of the 48 commodities modelled were primarily sourced (>50%) from areas of low conservation priority. This highlights potentially widespread conflict between agricultural land use and biodiversity conservation.
The exact level of conflict was found to vary based on the specific commodity measured, the country producing it, and the country consuming it. For example, certain key commodities consumed by a subset of middle- or high-income countries are the primary drivers of land use in agriculture–conservation conflict hotspots. The top five in terms of the area of land used in very-high conservation priority sites were Australian beef exported to Japan; Brazilian beef, soybeans, and pork exported to China; and Ivorian cocoa exported to the United States. Furthermore, trade in cattle, palm oil, coffee, wheat, and cocoa comprised 75 of the top 100 at-risk trade flows. Meanwhile, certain crops (sugar beet, pearl millet, sunflower, cotton, and some pulses) are much less likely to be grown in sites of agriculture-conservation conflict.
The major benefit of the high resolution spatial mapping performed in this study is that it can inform targeted approaches to conservation. For example, it can more effectively identify high-priority conservation areas at greatest threat from agriculture such that limited regulatory resources can be prioritised towards them. Moreover, the fact that many countries source the same agricultural products simultaneously from high-, medium-, and low-conservation priority locations highlights that greater transparency over a product’s source may provide the chance to switch to imports from areas that minimise agriculture-conservation conflict.
The results of this study have been visualised online and can be viewed here.
Paper abstract
Demand for food products, often from international trade, has brought agricultural land use into direct competition with biodiversity. Where these potential conflicts occur and which consumers are responsible is poorly understood. By combining conservation priority (CP) maps with agricultural trade data, we estimate current potential conservation risk hotspots driven by 197 countries across 48 agricultural products. Globally, a third of agricultural production occurs in sites of high CP (CP > 0.75, max = 1.0). While cattle, maize, rice, and soybean pose the greatest threat to very high-CP sites, other low-conservation risk products (e.g., sugar beet, pearl millet, and sunflower) currently are less likely to be grown in sites of agriculture–conservation conflict. Our analysis suggests that a commodity can cause dissimilar conservation threats in different production regions. Accordingly, some of the conservation risks posed by different countries depend on their demand and sourcing patterns of agricultural commodities. Our spatial analyses identify potential hotspots of competition between agriculture and high-conservation value sites (i.e., 0.5° resolution, or ~367 to 3,077km2, grid cells containing both agriculture and high-biodiversity priority habitat), thereby providing additional information that could help prioritize conservation activities and safeguard biodiversity in individual countries and globally. A web-based GIS tool at systematically visualizes the results of our analyses.
Reference
Hoang, N.T., Taherzadeh, O., Ohashi, H., Yonekura, Y., Nishijima, S., Yamabe, M., Matsui, T., Matsuda, H., Moran, D. and Kanemoto, K., 2023. Mapping potential conflicts between global agriculture and terrestrial conservation. Proceedings of the National Academy of Sciences, 120(23), p.e2208376120.
Read the full paper here. See also the TABLE Explainer What is the land sparing-sharing continuum?
Comments (0)