
Journal articles
Environmental benchmarking of the Swedish diet
FCRN member Elin Röös has co-authored this paper, which finds that the average Swedish diet far exceeds the planetary boundaries (scaled to the per capita level) suggested by the EAT-Lancet Commission for greenhouse gas emissions, cropland use, application of nutrients and biodiversity. The diet is within the boundary for freshwater use.

The EAT-Lancet Commission set out absolute boundaries for impacts on certain Earth systems affected by food production: climate change, land system change, freshwater, biodiversity, and nitrogen and phosphorus cycles. The paper downscaled each of these boundaries on the basis of equal impacts for every person, based on a 2015 world population of 7.4 billion people.
The figure below shows how the Swedish diet performs relative to these boundaries. Only water use falls within the boundary. Note that these boundaries refer to the maximum impacts allowed by the food system, not the maximum impacts from all human activity. For example, the EAT-Lancet Commission suggests allocating no more than half of the total allowable emissions in 2050 to food. For more details, see Section 2 of the EAT-Lancet report.
 Image: Figure 2, Moberg et al. Environmental impacts of the average Swedish diet relative to the boundaries in the EAT-Lancet framework. The red inner circle shows the per capita boundaries, i.e., 100% of the ‘allowed’ boundary, and each dotted outer circle shows transgression of the boundary by another 100%. Water use refers to consumptive water use.
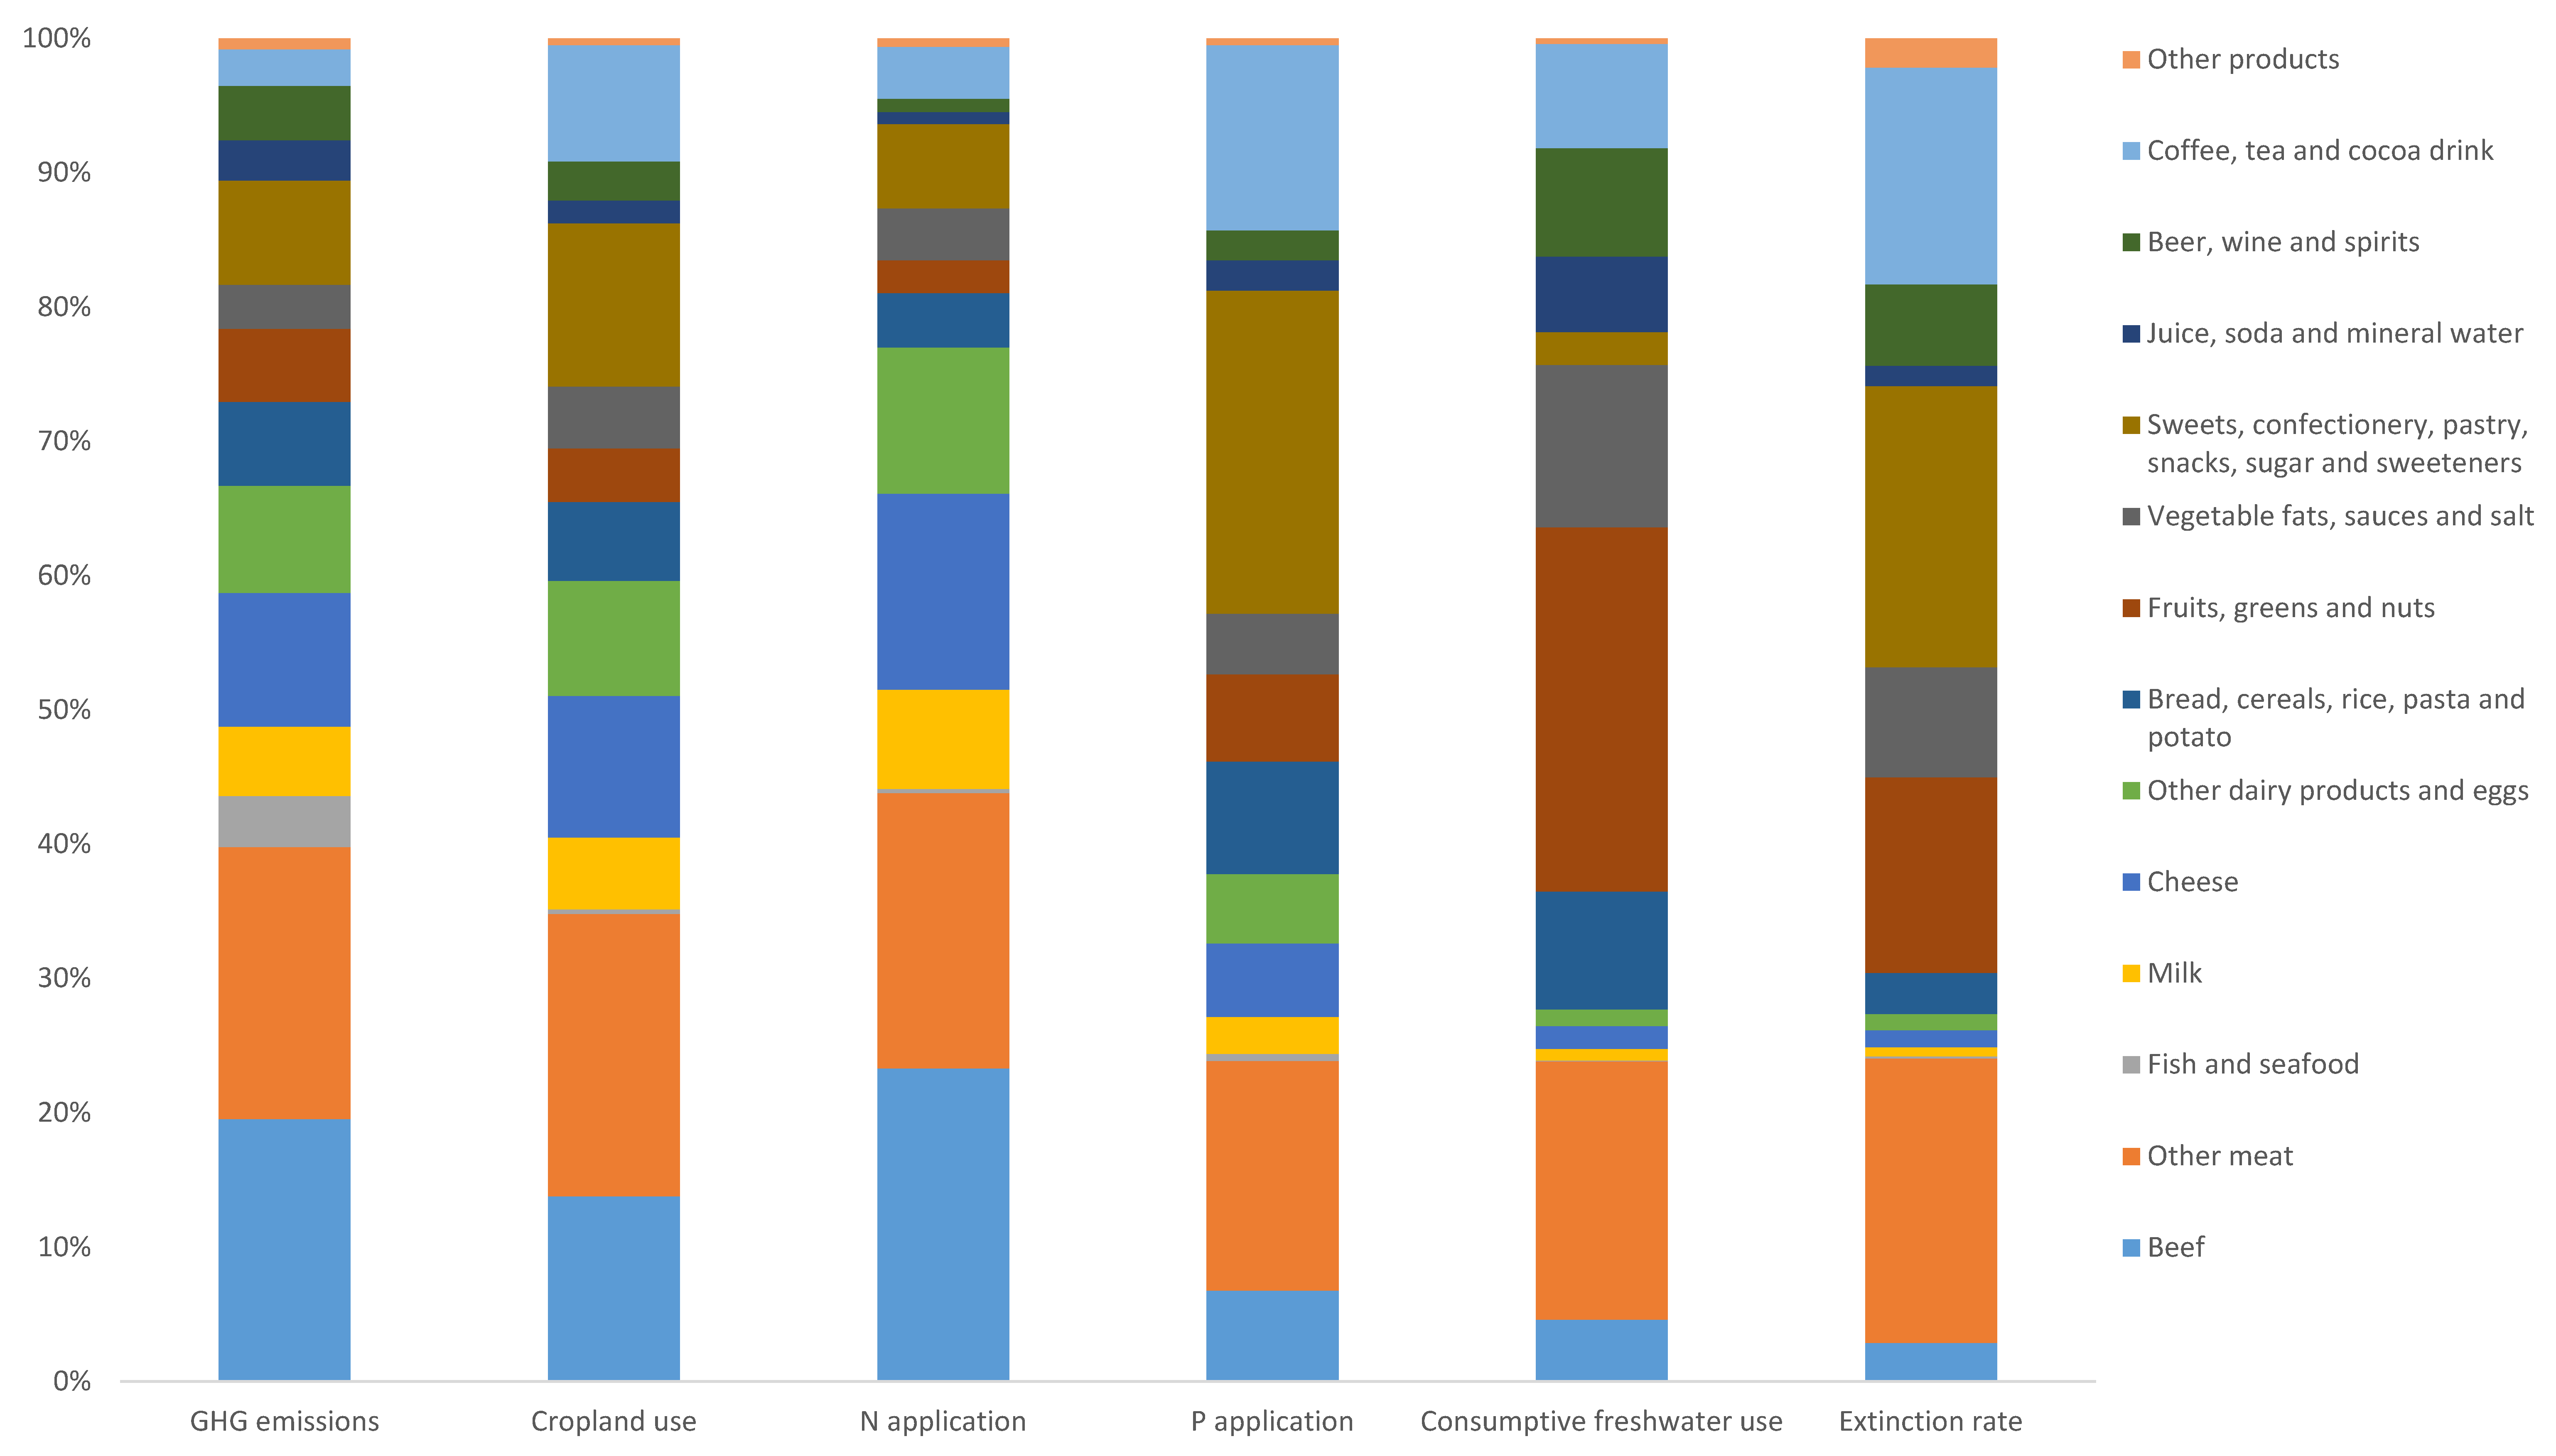
The figure below shows which food groups contribute to each of these six impact categories (view a high-resolution version here). For example, the greatest contributor to climate change is “other meat”, the greatest contributor to phosphorus application is “sweets, confectionary, pastry, snacks, sugar and sweeteners) and the greatest contributor to freshwater use is “fruits, greens and nuts”.
 Image: Based on Figure 4, Relative contribution by different food groups to the environmental impacts from Swedish food consumption.
Abstract
To reduce environmental burdens from the food system, a shift towards environmentally sustainable diets is needed. In this study, the environmental impacts of the Swedish diet were benchmarked relative to global environmental boundaries suggested by the EAT-Lancet Commission. To identify local environmental concerns not captured by the global boundaries, relationships between the global EAT-Lancet variables and the national Swedish Environmental Objectives (SEOs) were analysed and additional indicators for missing aspects were identified. The results showed that the environmental impacts caused by the average Swedish diet exceeded the global boundaries for greenhouse gas emissions, cropland use and application of nutrients by two- to more than four-fold when the boundaries were scaled to per capita level. With regard to biodiversity, the impacts caused by the Swedish diet transgressed the boundary by six-fold. For freshwater use, the diet performed well within the boundary. Comparison of global and local indicators revealed that the EAT-Lancet variables covered many aspects included in the SEOs, but that these global indicators are not always of sufficiently fine resolution to capture local aspects of environmental sustainability, such as eutrophication impacts. To consider aspects and impact categories included in the SEO but not currently covered by the EAT-Lancet variables, such as chemical pollution and acidification, additional indicators and boundaries are needed. This requires better inventory data on e.g., pesticide use and improved traceability for imported foods.
Reference
Moberg, E., Karlsson Potter, H., Wood, A., Hansson, P.A. and Röös, E., 2020. Benchmarking the Swedish Diet Relative to Global and National Environmental Targets—Identification of Indicator Limitations and Data Gaps. Sustainability, 12(4), p.1407.
Read the full paper here. See also the Foodsource resource Lifecycle assessment (LCA): quantifies environmental impacts from cradle to grave of a product.
Comments (0)