
Explainer
1 minute(s) read
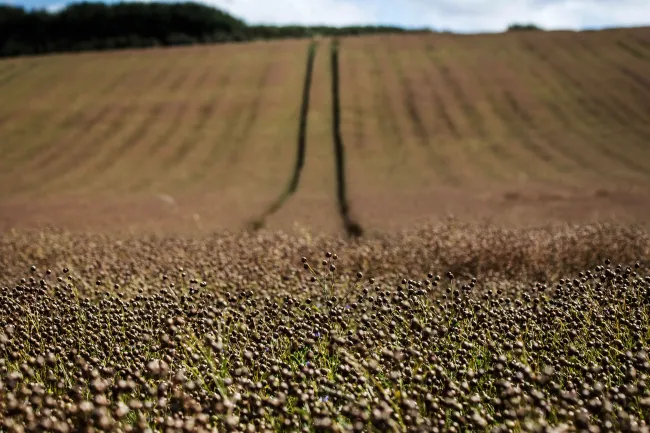
Food systems and greenhouse gas emissions
Emissions resulting from the many activities involved in food systems, account for a substantial portion of all human-caused greenhouse gas (GHG) emissions and, as such, contribute to climate change. A major challenge for the sustainability of food systems is, therefore to figure out how its contribution to GHGs can be reduced.
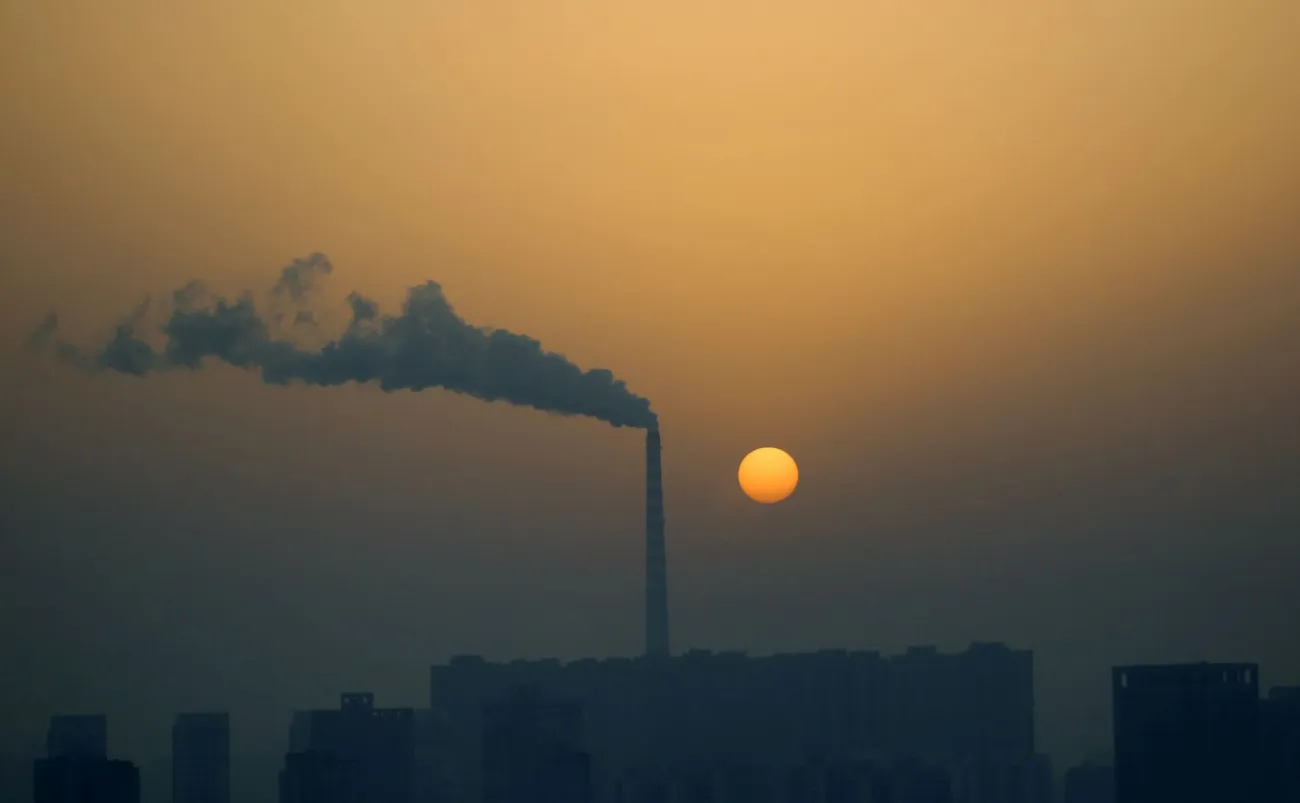
If we are to be able to address and mitigate food systems’ contributions to climate change, it is important to understand where and how the greenhouse gas emissions arise across the whole food system. Also important, is to understand how different ways of organising parts of the food system, can result in differing levels of greenhouse gas emissions.
Image


Comments (0)