
Resource
The Water Footprint of Humanity
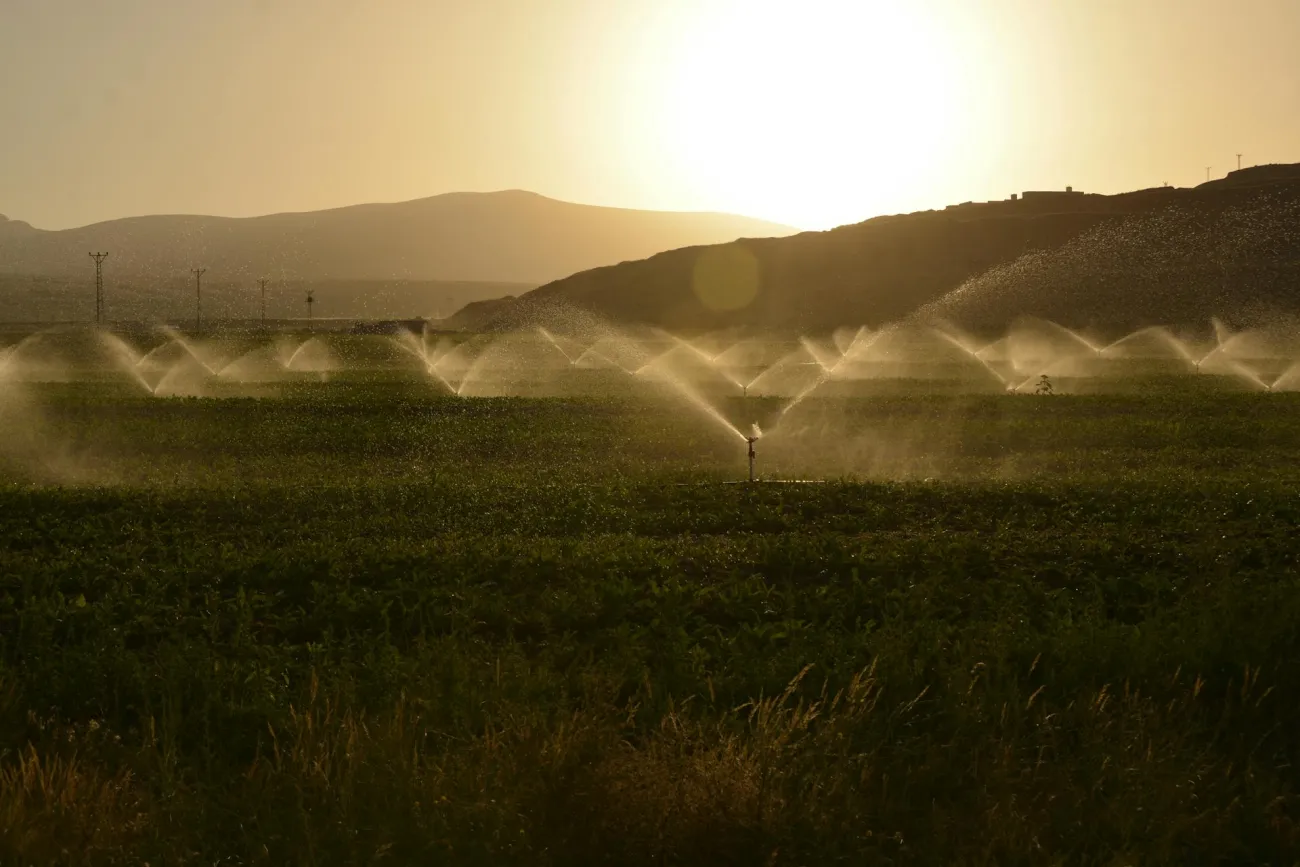
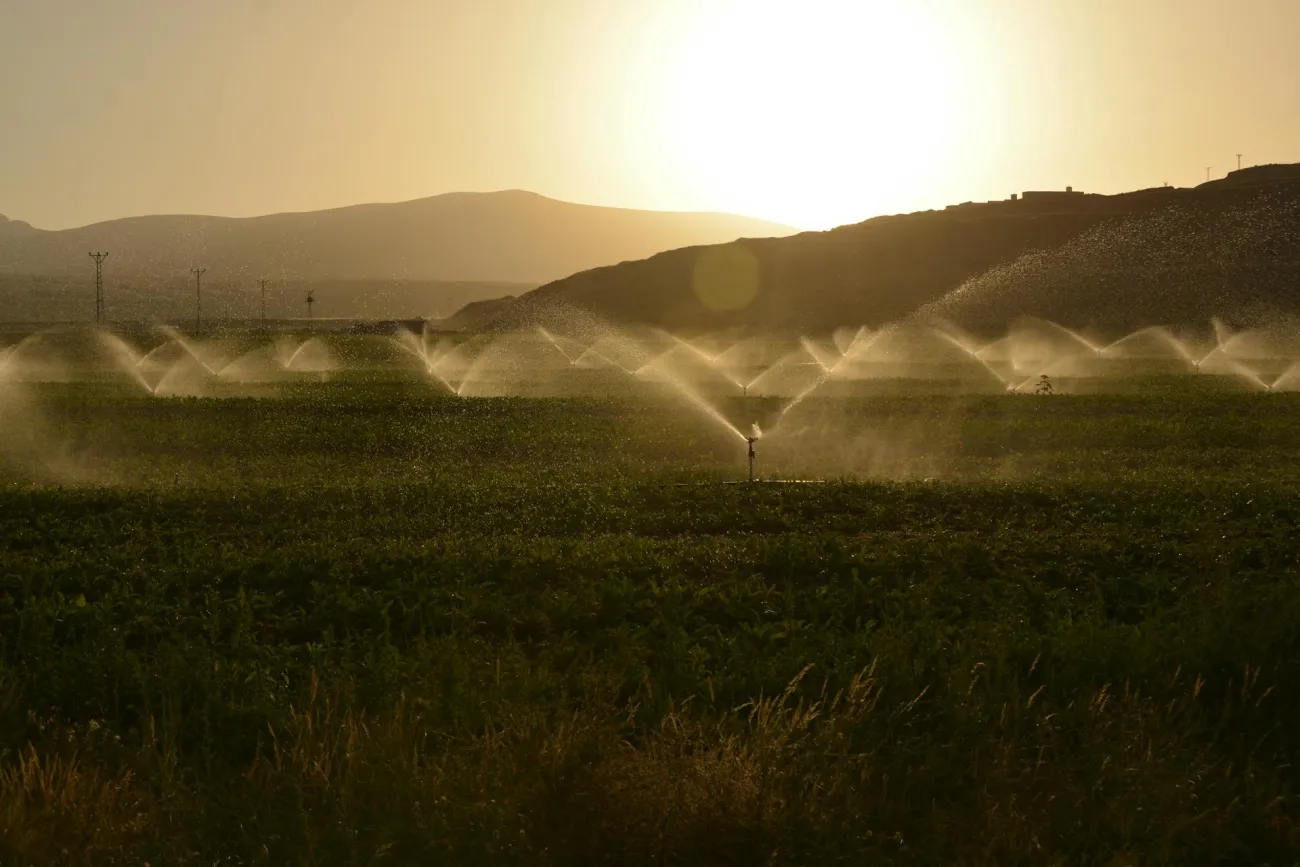
This study calculates and maps humanity’s green, blue and grey water footprint at a high spatial resolution.
It finds that a. agriculture is overwhelmingly the largest user of global water out of all human activities, b. production for exports accounts for a fifth of humanity’s water footprint, c. developed countries have on average a higher footprint than developing countries but there is huge variation in the footprint of developing countries, d. a country’s water footprint is a consequence both of agricultural production practices (itself reflecting use of irrigation and natural climatic conditions – ie. rainfall and efficiency of water use) and consumption habits (demand for water hungry foods).
Overall, it finds that wheat production is globally the largest water user, followed by meat although it is not clear from the study whether water use for meat includes the embedded water in feed crop production.
Abstract
This study calculates and maps humanity’s green, blue and grey water footprint at a high spatial resolution. The study reveals how different products and nations contribute to freshwater consumption and pollution across the globe. The findings may help governments to establish commodity production and consumption policies aimed at managing the planet’s finite freshwater supplies more effectively.
This study quantifies and maps the water footprint (WF) of humanity at a high spatial resolution. It reports on consumptive use ofrainwater (green WF) and ground and surface water (blue WF) and volumes of water polluted (gray WF). Water footprints are estimated per nation from both a production and consumption perspective. International virtual water flows are estimated based on trade in agricultural and industrial commodities. The global annual average WF in the period 1996–2005 was 9,087 Gm3∕y (74% green, 11% blue, 15% gray). Agricultural production contributes 92%. About one-fifth of the global WF relates to production for export.The total volume of international virtual water flows related to trade in agricultural and industrial products was 2,320 Gm3∕y (68% green, 13% blue, 19% gray). The WF of the global average consumer was 1,385 m3∕y. The average consumer in the United States has a WF of 2,842 m3∕y, whereas the average citizens in China and India have WFs of 1,071 and 1,089 m3∕y, respectively. Consumption of cereal products gives the largest contribution to the WF of the average consumer (27%), followed by meat (22%) and milk products (7%). The volume and pattern of consumption and the WF per ton of product of the products consumed are the main factors determining the WF of a consumer. The study illustrates the global dimension of water consumption and pollution by showing that several countries heavily rely on foreign water resources and that many countries have significant impacts on water consumption and pollution elsewhere.
Conclusions
The study shows that about one-fifth of the global WF in the period 1996–2005 was not meant for domestic consumption but for export. The relatively large volume of international virtual water flows and the associated external water dependencies strengthen the argument to put the issue of water scarcity in a global context. For governments in water-scarce countries such as in North Africa and the Middle East, it is crucial to recognize the dependency on external water resources and to develop foreign and trade policies such that they ensure a sustainable and secure import of water-intensive commodities that cannot be grown domestically. The water footprint of Chinese consumption is still relatively small and largely internal (90%), but given the country’s rapid growth and the growing water stress (particularly in North China), the country is likely to increasingly rely on water resources outside its territory, evidenced by China’s policy already today to buy or lease lands in Africa to secure their food supply.
The global average WF related to consumption is 1,385 m3∕y per capita over the period 1996–2005. Industrialized countries have WFs in the range of 1,250–2,850 m3 ∕y per capita, whereas developing countries show a much larger range of 550–3,800 m33y per capita. Two factors determine the magnitude of the WF of national consumption: (i) the volume and pattern of consumption and (ii) the WF per ton of consumed products. The latter, in the case of agricultural products, depends on climate, irrigation, and fertilization practice and crop yield. The small WF values for developing countries relate to low consumption volumes; the large values refer to very large WFs per unit of consumption. Detailed water footprint data as provided in this paper will help national governments understand to which extent the water footprint of national consumption relates to inefficient water use in production and to which extent it is inherent to the existing national consumption pattern. Thus it helps governments that strive toward more sustainable water use to prioritize production policies (aimed to increase water use efficiency) versus consumption policies (aimed to influence consumption patterns so that inherently water-intensive commodities are replaced by commodities that require less water).
The study provides important information on the WFs of nations, disaggregated into the type of WF (green, blue, or gray) and mapped at a high spatial resolution. This paper shows how different products and national communities contribute to water consumption and pollution in different places. The figures can thus form an important basis for further assessment of how products and consumers contribute to the global problem of increasing freshwater appropriation against the background of limited supplies and to local problems of overexploitation and deterioration of freshwater bodies or conflict over water. Once one starts overlaying localized WFs of products or consumers with maps that show environmental or social water conflict, a link has been established between final products and consumers on the one hand and local water problems on the other hand. Establishing such links can help the dialogue between consumers, producers, intermediates (like food processors and retailers), and governments about how to take and share responsibilities to reduce the WFs where most necessary.
The supplementary info provides more detailed data including a breakdown of blue water use by individual countries.
Reference
Hoekstra A Y and Mekonnen M M (2012). The water footprint of humanity. PNAS,109, 9, 3232-3237
You can download the paper itself as well as the supplementary material (both open access) here.
Comments (0)