
Explanation
Why should you read this explainer?
This explainer provides an overview of the key points about methane, and addresses some common areas of confusion, covering:
- What is methane and how does it affect the climate?
- Where do methane emissions come from?
- What happens to these methane emissions?
- How has agriculture contributed to recent increases in atmospheric methane?
- What does all this mean for how we consider methane emissions, particularly in relation to carbon dioxide (CO2)?
1. What is methane and how does it affect the climate?
Methane is a very simple molecule, composed of one carbon and four hydrogen atoms (Figure 1), hence its chemical formula CH4.

Methane is an important greenhouse gas (GHG), second only to carbon dioxide (CO2) in terms of its overall contribution to human-driven climate change1. GHGs affect the climate by changing the balance between incoming and outgoing energy (incoming from the sun, outgoing back from the Earth). As GHG concentrations in the atmosphere increase, a larger proportion of outgoing radiation is now absorbed by these GHGs, some of which is re-emitted back towards the Earth’s surface rather than carrying on out to space. This change in the atmospheric energy balance is known as radiative forcing (or simply ‘forcing’, see glossary), and the Earth warms up in response.
Methane is also a powerful greenhouse gas, much stronger than CO2. If atmospheric concentrations of methane and CO2 increased by the same amount (on a per molecule basis), the increase in methane would lead to around 26 times more forcing than the increase in CO22. This property is known as the radiative efficiency of a gas, and can also be thought of as representing the ‘strength’ of the direct climate impact per molecule or tonne of each gas in the atmosphere. Methane also has an indirect impact on the climate through the generation of ozone and water vapour, which are also greenhouse gases (covered further below).
2. Where do methane emissions come from?
Methane emissions are generated by a number of processes, both natural and resulting from human activity (‘anthropogenic’).
Most natural methane emissions arise from microbial decomposition of organic material (for example, decaying plants) in anaerobic (‘lacking oxygen’) conditions in wetlands.
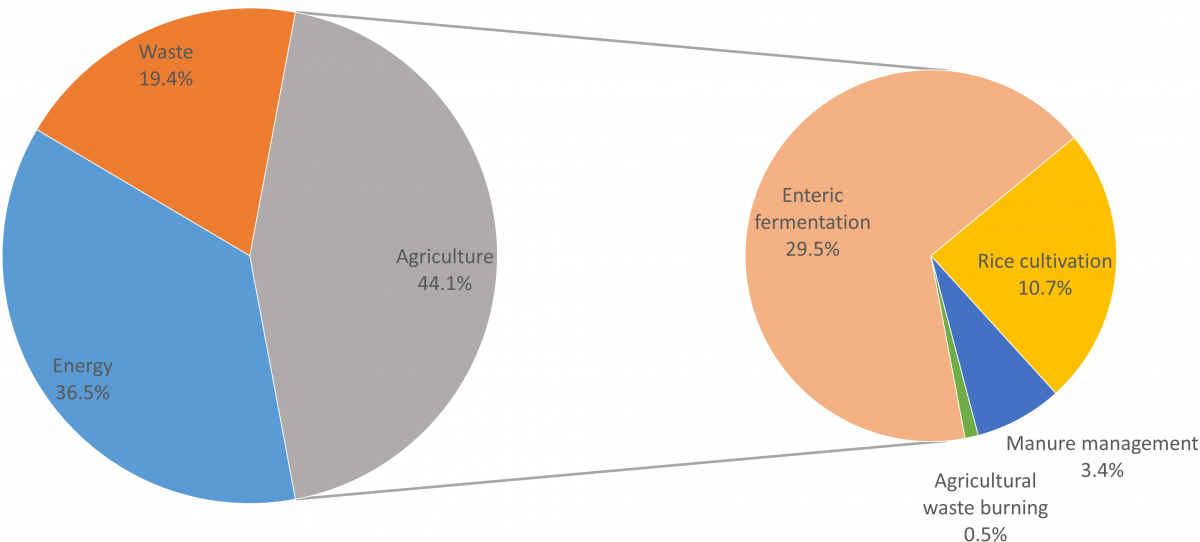
There are a number of sources of anthropogenic methane emissions. Fossil-fuel methane (commonly referred to as ‘natural gas’) may be emitted to the atmosphere in the process of extracting coal or oil, or from leakage during the extraction, storage or distribution of natural gas. The waste sector is another source of methane, which arises when microbes digest organic matter in the waste. But agriculture is the activity responsible for the single largest share of anthropogenic methane emissions, estimated in one recent study at around 44% of anthropogenic methane in 20123.
The biggest source of agricultural methane emissions is enteric fermentation, which is the digestive process by which microbes in the guts of ruminant livestock break down plant matter, enabling it to be absorbed into the animals’ bloodstream, and producing methane as a by-product. Almost 30% of total anthropogenic methane in 2012, or about two thirds of the agricultural total, is from this source. Significant amounts of methane are also emitted where rice is grown in flooded paddies (11% total anthropogenic methane in 2012), where the anaerobic conditions facilitate microbial methane-generation similarly to natural wetlands. A third major source of agricultural methane emissions arises from losses of organic matter in manures (from both ruminant and non-ruminant livestock) (3% total anthropogenic methane in 2012), and a small amount of methane is emitted from the burning of agricultural wastes (0.5%).
3. What happens to these methane emissions?
As well as the strength of each GHG (their radiative efficiency), to understand how emissions will impact the climate, we also need to know how long these emissions will last in the atmosphere (their ‘atmospheric lifetime’). This is particularly important for methane, as it is a relatively short-lived GHG, with emissions breaking down after an average of around 10 years. In contrast, a significant proportion of our CO2 emissions are expected to persist in the atmosphere for centuries, or even longer.
Approximately 95% of the methane is ‘removed’ or broken down in the atmosphere itself. Most of this (84% of total removals) is in the lower atmosphere (‘troposphere’), and results from a reaction with hydroxyl (OH) radicals – highly reactive molecules that play an important role in the removal of many other atmospheric pollutants in addition to methane. Ultimately, as a result of this process, much of the methane is broken down into CO2. However there is still some scientific uncertainty over exactly how much of the methane is finally converted to CO2 and how much might remain as other intermediate carbon-containing compounds without a significant direct effect on the climate4.
In the case of agricultural methane, this resultant CO2 is essentially replacing that which was first fixed as plant biomass via photosynthesis. As such, it does not need to be considered as an additional source of CO2, for the same reason we do not consider CO2 from livestock (or human) respiration (breathing out) as an extra greenhouse gas emission. Importantly, this also means that methane from agriculture is different from fossil fuel methane (see above), because for fossil fuel methane this CO2 is an additional input to the atmosphere, which had previously been locked away underground2.
A smaller proportion (8%) of methane is also oxidised by OH radicals in the upper atmosphere (‘stratosphere’); there is also thought to be an additional small amount of removal (around 4%) of atmospheric methane by reaction with chlorine radicals.
It is important to note that these reactions between methane and OH radicals produce ozone and stratospheric water vapour as by-products. Both ozone and water vapour are also greenhouse gases (see note5), and add an indirect effect that increases the radiative forcing due to methane emissions by around a third more than the direct effect of the methane itself2. Increased concentrations of ozone at the Earth’s surface also reduce plant growth, with potentially significant implications for total carbon budgets6 (5) by reducing the rate at which plants can remove CO2 from the atmosphere, and causing crop yield reductions of up to 10%7.
The remaining 5% of atmospheric methane removal occurs in soils. Although relatively small compared to atmospheric removals, there is potentially scope to increase this removal effect by a small degree, since different land-uses and management can change the balance between microbes in the soil that either produce or remove methane (‘methanogenic’ and ‘methanotrophic’, respectively). In general, it is thought that agricultural soils have lower methane removal rates compared to soils with native vegetation, and in some cases these agricultural soils end up producing rather than removing methane8. However, agricultural soils can also act as methane sinks9, and it may be possible to increase removal rates through management interventions such as adding appropriate composts10. There could therefore be a potential role for agricultural management to maintain or enhance soil methane removals. However, there has been relatively little research into this topic, and soil removals will likely remain a small proportion of methane removals.
4. How has agriculture contributed to recent increases in atmospheric methane?
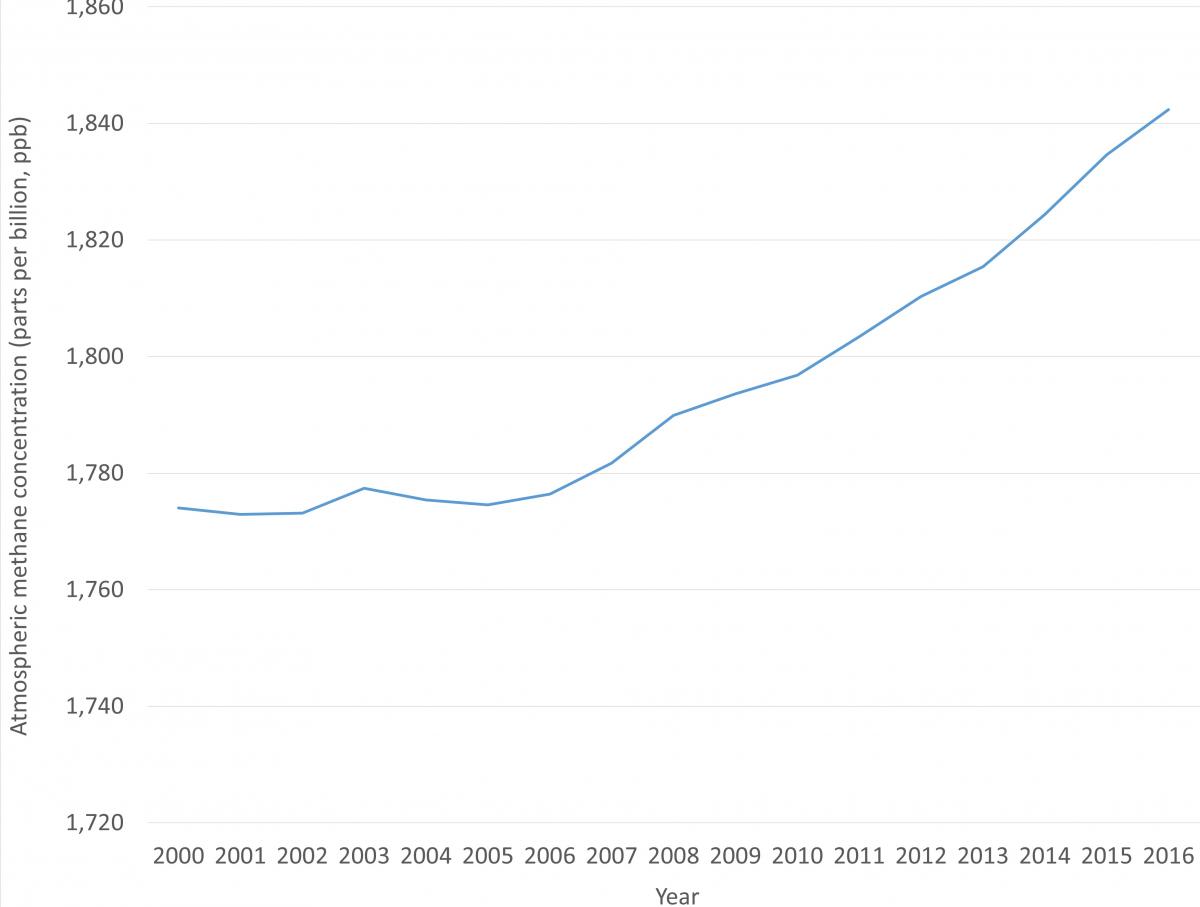
Over the last decade methane concentrations have increased rapidly (Figure 3). It is difficult to confirm exactly how much of this increase is due to agriculture, to other anthropogenic sources, and to increases in natural methane emissions; or whether there are more complex changes in the atmospheric chemistry of methane at play, slowing down the rate at which it is broken down. Increases in agricultural methane could explain some of the increase; however it has not yet been possible to precisely quantify the different source contributions. What is certain is that actions to reduce any anthropogenic methane emissions present important opportunities for reaching our climate mitigation targets11.
Can we identify the individual sources for methane in the atmosphere?Ongoing research can help to overcome some of the uncertainties over how different sources contribute to recent changes in global methane concentrations in the atmosphere. We can get a better picture of how much methane real-life agricultural systems are emitting using monitoring techniques (a method called eddy covariance), to, for example, detect and quantify methane from rice paddies12,13 and grazing ruminants14,15. At larger scales, subtle differences between the types of methane emitted from different sources – the isotopic signature – can be used to show what broad source category atmospheric methane came from. This approach points to biological sources, such as agriculture16, wetlands17 or both18, as a key driver of recent atmospheric increases, but increases in fossil-methane sources cannot be ruled out as important contributors to the trend18. There is still a lot about methane emissions that we don’t know, but continued research from atmospheric monitoring to agricultural management is helping to improve our understanding. |
5. What does all this mean for how we consider methane emissions, particularly in relation to carbon dioxide (CO2)?
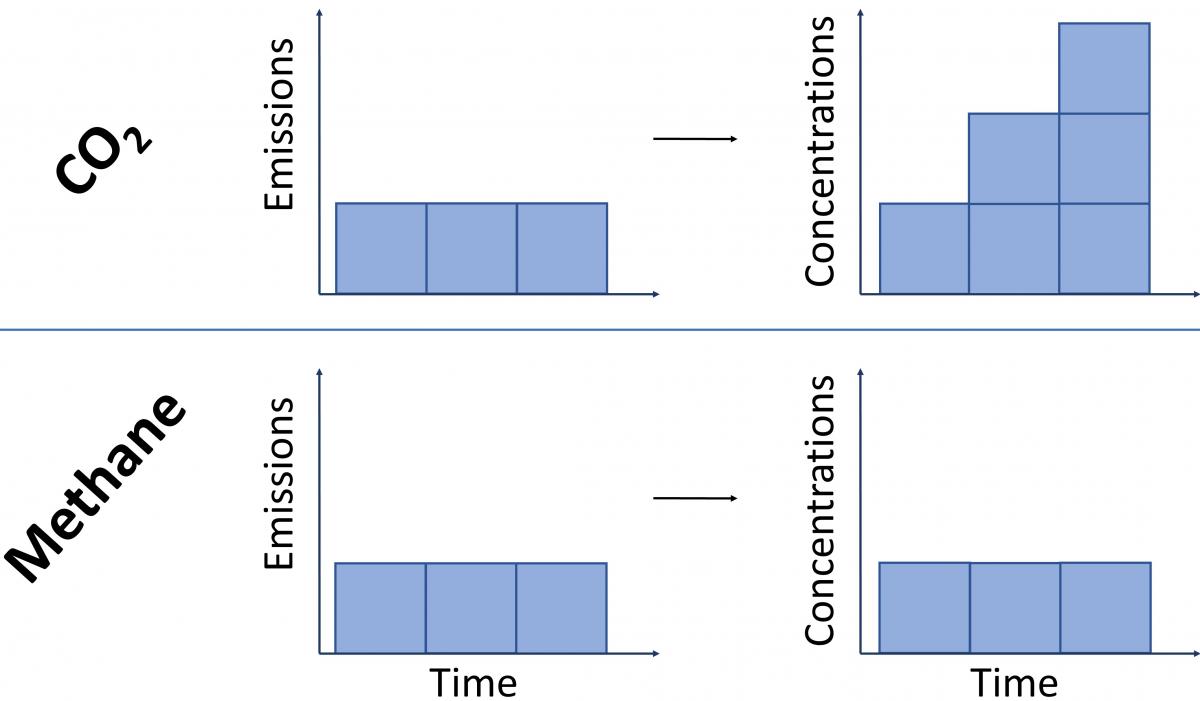
Because CO2 emissions last in the atmosphere for so long, we have to consider them as a cumulative pollutant – i.e. new emissions are added on top of those that were previously emitted, leading to increases in the total atmospheric stock of CO2.
In contrast, because it breaks down rapidly, methane emissions do not act cumulatively. For a constant rate of methane emissions, one molecule in effect replaces a previously emitted one that has since broken down. This means that for a steady rate of methane release – as emitted by a constant number of cattle, for example – the amount of methane in the atmosphere stays at the same level, but does not increase.
To illustrate by way of an analogy: imagine a bath filling with water. In the case of CO2, we have a constant ‘flow’ of water representing ongoing emissions, but the drain is mostly blocked, and so the bathwater will steadily increase for as long as the tap is running. For methane, if we turn on the tap (i.e. start emitting methane) the bath water will initially fill to a high level, but after a short delay the bath can start to drain (the removals described in section 3 above) at a rate that balances the ongoing flow. This means that provided the tap is not opened further (i.e. the rate of flow remains constant), the bathwater remains at that high water level, but without filling further.
This concept is illustrated in Figure 4 below19.
This means that to stop further warming, we need to bring emissions of CO2, and other long-lived greenhouse gases, down to net-zero (i.e. zero emissions; or else any remaining emissions are offset by removals from the atmosphere). For methane, however, it is possible to have ongoing emissions that do not result in continuing increases in temperature.
But this does not mean we can ignore methane. Even if stable, the ongoing methane emissions maintain elevated concentrations, and hence a continued – even if not significantly increasing – impact on the climate.
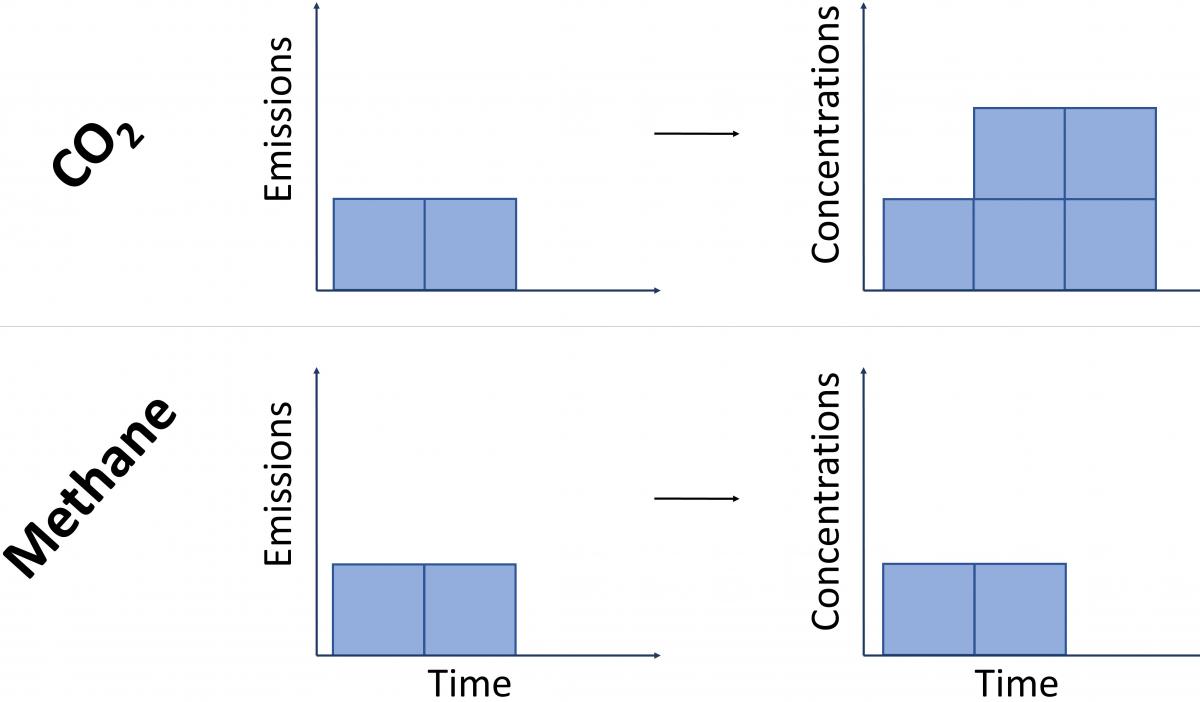
And increasing methane emissions result in increasing atmospheric concentrations. Since methane has a powerful effect as a greenhouse gas, even relatively small increases in concentration can have a major climate impact, making the recent observations of increasing atmospheric methane highly concerning. The reverse is also true. Because of its short atmospheric lifetime, if we reduce methane emissions, we expect the atmospheric concentration would fall relatively quickly (Figure 5). So reducing methane emission rates presents an important mitigation opportunity which could reverse some of the warming we already experience.
What does this imply for the way we assign numerical values to methane and carbon dioxide?
It is well recognised that these important differences between the two gases are not captured well in the way we currently describe emissions of different gases as carbon dioxide equivalents (CO2e) using the 100-year Global Warming Potential (GWP100). Various other metrics have been proposed, including recently the GWP*. GWP* focuses on the change in rate of methane emissions, compared to the total amount of CO2 (and other long-lived gases)20. Using GWP*, changing the rate of methane emissions is assigned a much higher CO2-equivalence than it is under GWP100; as such it better captures the risks of increasing and the benefits of decreasing methane emission rates. But maintaining emissions at the same rate for more than a couple of decades is valued as a lower equivalent amount of CO2 than under GWP100, reflecting the non-cumulative impacts of stable methane emissions noted above
The GWP* approach offers a very different way of thinking about methane emissions than the conventional GWP approach, as employed in typical reporting of emissions. Some of the possible implications for agriculture are only just starting to be explored, and this topic will be revisited in further pieces from the FCRN.
Download the PDF version of this explainer here.


Comments (0)