
Essay
GWP*: Methane, metrics and confounding science and policy
Martin Persson is an Associate Professor at Physical Resource Theory, Department of Space, Earth & Environment at Chalmers University of Technology, Sweden. In addition to greenhouse gas metrics, his research focuses on the role of agricultural production, trade and consumption in driving tropical deforestation, as well as policies for halting the loss of forests.

Image: Omotayo Tajudeen, Man in Brown and White Stripe Long Sleeve Shirt Holding Brown Wooden Stick, Pexels, Pexels Licence
Greenhouse gas metrics, which aim to measure the climate impact of emissions of different greenhouse gases on a common scale, have long been a hotly debated issue in food and climate discussions. There is a simple reason for this: the choice of metric matters crucially for assessing the carbon footprint of some food products – such as beef and dairy – that emit large quantities of methane when produced, and yet there is no single correct way of making these comparisons. The metrics debate has been rekindled in the last years by the introduction of a new metric, GWP*, that claims to better reflect the climate impact of short-lived greenhouse gases such as methane. Here I explain the rationale behind the GWP* metric, but question the policy conclusions drawn by the proponents of GWP* in terms of how methane mitigation should be incentivised.
The largest challenge of constructing greenhouse gas metrics lies in finding a way to equate the climate impacts of emissions of gases with large differences in strength and atmospheric lifetimes. Take the most commonly used metric today, Global Warming Potential (GWP), that measures the impact of a pulse emission on radiative forcing (a measure of the energy imbalance caused by elevated levels of greenhouse gases in the atmosphere and hence a proxy for temperature increase) over a given time period. As illustrated in the figure below, the cumulative effect on radiative forcing over the next 100 years of emitting 28 tons of carbon dioxide (CO2) today is the same as emitting 1 ton of methane (CH4). Hence, the GWP100 value for methane is 28 [1].
However, as is also evident from the figure, because of the different atmospheric lifetimes of the two gases – a fraction of CO2 emissions staying in the atmosphere more or less indefinitely, while most CH4 is gone within decades [2] – the temperature change profile of the two emission pulses are distinctly different. Hence, it has long been known that emission scenarios that have equivalent emissions as measured using GWP can result in very different temperature change profiles, depending on the mix of long- and short-lived greenhouse gases. Fixing this is the rationale of the GWP* metric. It does so in an elegant way: instead of comparing pulse emissions of gases with very different lifetimes – which will invariably lead to very different climate outcomes – it compares pulse emissions of long-lived gases (e.g. CO2) with a continuous emission of short-lived (e.g. CH4), so that the cumulative emissions of both gases are equivalent if compared using the standard GWP metric.
As can be seen in the figure below, emitting 0.01 MtCH4/yr over the next 100 years (for a total of 1 MtCH4) is much more similar – in terms of both radiative forcing and temperature change – to a pulse emission of 28 MtCO2, than is emitting that one MtCH4 today. Hence, argue the authors in the scientific paper presenting the GWP* metric, measuring emission pathways and targets (e.g. the Nationally Determined Contributions of countries under the Paris Agreement) using GWP* is superior to GWP, in terms of how well climate impacts are captured.

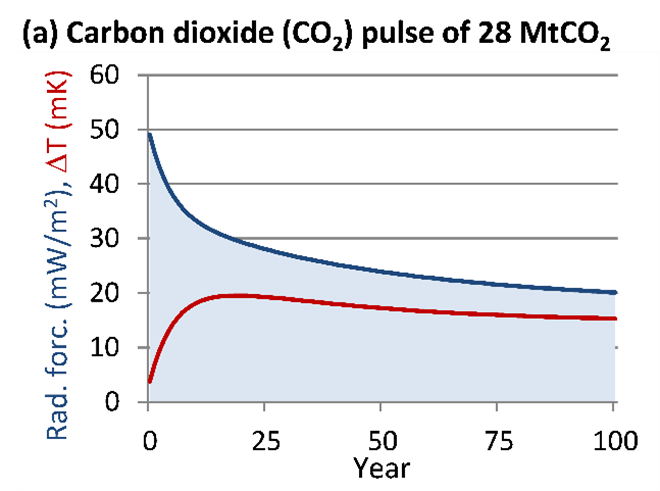

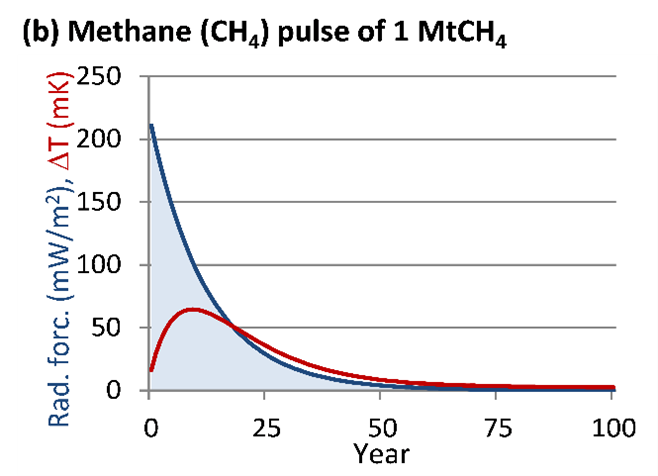

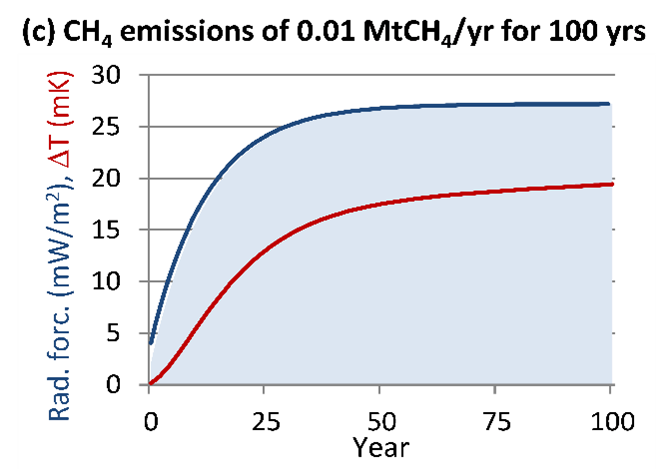
These graphs show the impacts of emitting (a) 28 MtCO2 and (b) 1 MtCH4 in year zero, or (c) 0.01 MtCH4/yr over 100 years, on radiative forcing (blue curve) and temperature change (red curve). The area under the blue curves – signifying cumulative radiative forcing, the basis for the Global Warming Potential (GWP) metric – is (roughly) equal in all three graphs. Note that the vertical axes in each graph are not to the same scale. Based in the model from Persson et al. (2015).
So far this is the science, and it is rock solid. But what about the policy implications of all this? How would one go about implementing a climate policy where we equate pulse emissions of some greenhouse gases with continuous emission rates of others? And what implications would it have for incentivising the reduction of emissions of different greenhouse gases, for instance through taxation or emission trading schemes?
The answers to these questions are not detailed in the academic original GWP* paper, but have partly been spelled out in accompanying blog posts and a later study. A key argument made in these publications is that increases in emissions of methane and other short-lived greenhouse gases should be penalised, near-constant emissions should not [3], and emission reductions should be subsidised. The logic behind this is the fact that a constant level of emissions of CH4 results in constant atmospheric concentration levels, because CH4 is constantly being broken down and removed from the atmosphere (in contrast to CO2 emissions, part of which stay in the atmosphere and add to the atmospheric carbon stock). Hence, it is argued, stable CH4 emissions “make no further contribution to warming” and should not be penalised.
The question, however, is: no further contribution compared to what? A constant level of emissions may lead to no additional warming beyond current levels, but it does lead to more warming than if the CH4 was not emitted. And current warming has already “fundamentally transformed our planet and its natural systems”, with consequences including heatwaves, drought-induced forest fires, flooding from increased precipitation and sea-level rise, and bleaching of coral reefs, resulting in considerable economic and livelihood impacts across the globe. Hence, it does seem reasonable to introduce incentives for also reducing the emissions that maintain this warming [4] and the damages it causes.
The argument that this incentive should be a subsidy for reduced emissions, rather than a tax on actual emissions, is an example of what in environmental policy is commonly known as grandfathering. Grandfathering implies that pre-existing resource users or polluters get preferential treatment in environmental policy, for example when there is free allocation of emission permits in a cap-and-trade system to existing emitters (as was the case in the early stages of the EU emission trading scheme).
However, research shows that grandfathering typically reduces the effectiveness of environmental policy, since it creates perverse incentives to push up emissions in order to get a larger allocation of pollution rights. Certainly, the actors responsible for the major sources of anthropogenic methane emissions – from livestock rearing and fossil fuel production – would have large incentives to increase emissions if there is a prospect of these emissions being included in future climate policies that do not penalise near-stable emissions (or even subsidise emission reductions) [5]. Farming groups have already seized upon this line of argumentation, claiming that science got it all wrong and that there is no need to implement policies that aim to reduce emissions from livestock systems. Grandfathering can also be perceived as highly unfair, as it penalises new entrants to a market: why should the farmer whose “great-grandparent pushed up global temperatures when they were building up the herd of cattle” not have to pay for methane emissions, while a new farmer setting up operations today (and therefore increasing emissions) would?
The arguments around the merits of grandfathering are partly empirical (does it lead to inefficient climate policy?), and partly political (is it fair?). However, using the GWP* metric as an argument for the position that methane emissions should be grandfathered is confounding science and policy. The GWP* metric need not be based on a grandfathering principle, but can be modified to reflect other—more equitable—benchmarks than historical emissions.
The benefit of GWP* is that it clearly quantifies the climate change resulting from emission scenarios for greenhouse gases with different atmospheric lifetimes. This is a benefit as regards scientific understanding. The societal challenge now is for policy makers to use that knowledge when developing climate policies that lead to outcomes that are both environmentally beneficial and equitable. The discussion about which metric to use ultimately needs to be informed by broader considerations than just climate science, remembering that metrics are tools that can serve multiple goals and hence that no one metric is superior for all uses. Rather than ‘one metric to rule them all’, we should think about how different metrics can complement each other, so as to provide a more nuanced understanding of climate change and climate policy.
For instance, the GWP* metric makes it easy to quantify the effect of different emission pathways on future temperature change, making it useful for policy assessments (be it sectoral climate targets or National Determined Contributions under the Paris Agreement). Standard GWPs (or other pulse-based emission metrics), on the other hand, are better suited for making comparisons between commodities or production systems that give rise to emissions of different greenhouse gases, something that is needed for helping consumers and other actors making more climate friendly choices (for example through product labelling or carbon pricing). Clearly there is much work to do in this area. The methane debate has become somewhat overheated in recent years. There is a real need for more collaborative approaches, where physical scientists, policy researchers and policymakers work together to find constructive ways forward.
To share your thoughts on this blog post, send a message to the FCRN’s Google Group (join here). See also the Foodsource building blocks Agricultural methane and its role as a greenhouse gas and Methane and the sustainability of ruminant livestock.
Footnotes
1. According to Lynch and colleagues, the metric value for methane should be calculated as: GWP*Methane = (4 – 3.75 · Et-20 / Et0) * GWP100, where Et0 and Et-20c are methane emissions today and 20 years ago, respectively. This implies that if emissions are reduced by about 0.3%/yr, the metric equals zero. The scale at which methane emission trends are evaluated – e.g., at global, national or firm level – will of course have huge implications for the metric value used in policy, but this choice is not discussed in the paper (though in her blog post Michelle Cain seems to suggest it should be evaluated at firm-level).
2. Elevated methane concentrations (including indirect effects) constitute about a third of total radiative forcing from well-mixed greenhouse gases (see Fig. 8.17 in Climate Change 2013: The physical science basis).
3. Note also, that following Lynch and colleagues (see formula in footnote above), it would take sustained methane emissions increases of more than 1%/yr (or reductions of nearly 2.5%/yr) to make the proposed GWP* metric equal that of GWP100. Thus, it is hardly fair to claim that using the standard GWP is “Dangerous, as it can greatly understate the impacts of increasing methane emissions, and obscure the fundamental need for net-zero CO2 emissions as soon as possible”.
4. Disregarding the effect of methane emissions of the carbon cycle.
5. Note, however, that while methane is characterised as a short-lived greenhouse gas in terms of its atmospheric lifetime (on average 12 years), the climate impacts of methane emissions are far from short-lived: it takes over 700 years for the temperature change effect of a pulse emission of a tonne of CO2 to rival that of a pulse emission of a tonne of methane.

Comments (0)