
The global growth in the production of soy and its use for different types of foods has been, and continues to be, a major contributor to land use change in the Amazon and other regions in South America.
This building block explores the connections between soy, land use change, and discussions on animal- versus plant-based protein sources.


Explanation
2. Basic facts and figures on soy
3. What has driven the global increase in soy production?
4. Soybean production and deforestation in South America
4.1 Is soy a driver of land use change in South America?
4.2 What drives soy expansion in South America?
4.3 Mitigation of soy-related land use change
5. What does this mean for discussions about animal- and plant-based protein sources?
1. Introduction
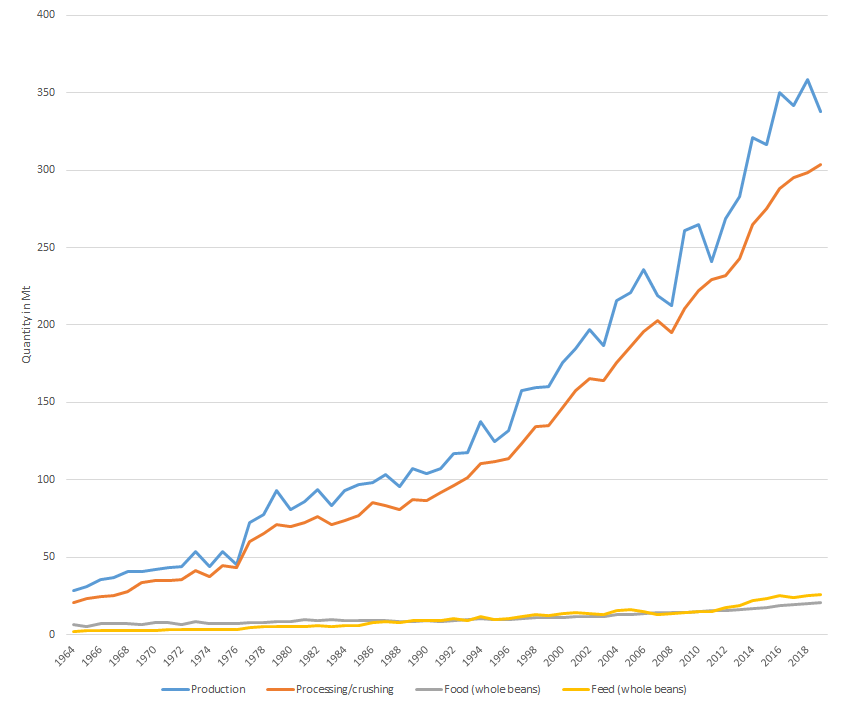
Over recent decades, the global production and consumption of soy have greatly increased (Figure 1). Soy is now one of the most widely grown crops in the world (the sixth by production volume and the fourth by both production area and economic value1 ,2 ), but there is much concern about the sustainability of soy production, in particular because of its links to deforestation and loss of native vegetation in the Amazon and other areas of South America. While soy is often seen as a valuable source of protein in plant-based diets, most soy (around 75% measured by weight) is currently fed to animals in livestock production systems. By weight, over two thirds of the soy consumed by humans consists of soy oil, which is also increasingly used as a biofuel.
This building block explores the linkages between soy, land use change, and discussions on animal- versus plant-based protein sources.
2. Basic facts and figures on soy
Soy has been cultivated since ancient times in Asia but it is only during the last century that its production has spread across the world, fostered by the breeding of cultivars that are suited to different climatic conditions4 .
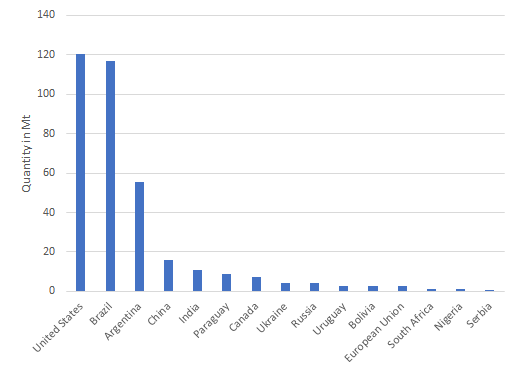
The three largest producers of soy (by weight and production area) are the US, Brazil and Argentina (Figure 2); in 2018-19, these countries were jointly responsible for about 82% of global soy production3 . While the US has been a leading soy producer since the 1940s1 ,5 , South America’s share has increased enormously in recent decades: Brazil, Argentina and Paraguay alone are now responsible for almost 50% of the global soy production volume, up from less than 3% in the 1960s1 ,6 . USDA projections for 2019-20 show Brazil becoming the world’s largest soy producer.
The growth of soybean has been driven by the demand for soy for crushing (Figure 1). Whole soybeans are crushed to separate oil (about 20% by weight) and cake (about 80% by weight). The protein-rich cake is an important animal feed ingredient, accounting for around 70% of the global production of protein meals7 ,8 . Soybean is unusually rich in fat for a legume . Soy oil accounts for over 25% of global vegetable oil production (second only to palm oil)7 and is mainly used in industrial food manufacturing and as a biofuel. Soybeans that are not crushed are either used as a whole bean feed for animals or to produce foods for human consumption, such as tofu, edamame and soymilk.
What is soy being used for?According to USDA estimates, 87% of the global soy output is processed into soy oil and soy cake, with the latter used almost entirely as an animal feed (see Figure 3). Only 6% of global soy output is used for foods for human consumption that are produced from whole soybeans (e.g. edamame beans, tofu, soymilk, soy sauce, or tempeh) and another 7% is used as a whole-bean animal feed. 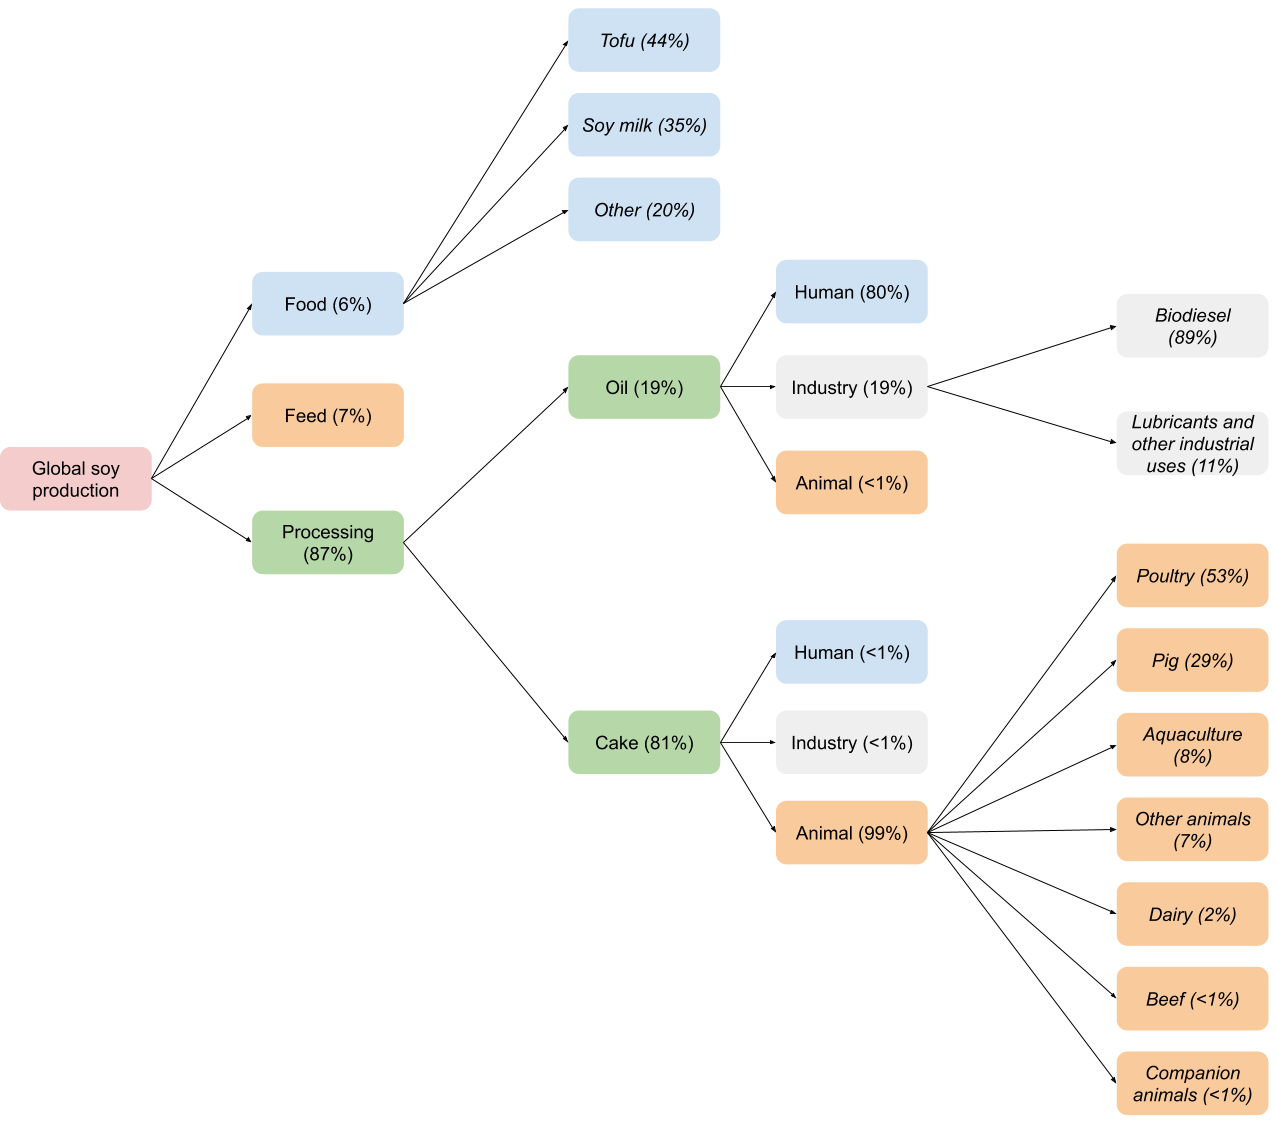 The 87% of soy used for processing is first crushed to separate crude soy oil from defatted soy cake. Soy oil is mostly used in commercial food manufacture (80%) where it is used as a vegetable oil or further processed into other products such as soy lecithin (an emulsifier and lubricant). The remainder is almost entirely used for biodiesel (estimated at 18%) – mostly by the US, Brazil, Argentina, and the EU. The use of soy oil for biofuel is increasing (Figure 4). 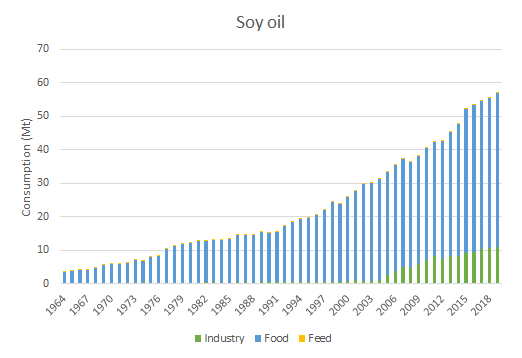 99% of soy cake is used as an animal feed ingredient (see Figure 3 and 5) – mostly in pig and poultry farming (respectively 29% and 53%), but also in aquaculture (8%) and dairy farming (2%). Less than 1% of soy cake is used for human consumption. This is further processed into protein-rich food ingredients such as textured vegetable protein. Because of its high protein content and meaty texture, textured soy protein is often used in products such as vegetable burgers. 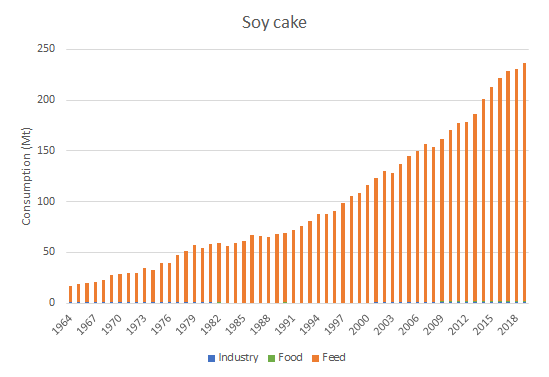
|
Because it is high in protein, soy is often viewed by advocates of more plant-based diets as a potentially important component of a sustainable food system. Soy contains more protein than many other grains and legumes (around 40% of its dry matter weight versus 20-30% for chickpeas or lentils16 ,17 ), while the amount of protein in cooked soybean (around 19%) is comparable to that in nuts (15-20%) and only slightly lower than that in cooked chicken or pork meat (25-35% depending on the cut)16 ,17 .
The quality of that protein is also good: unlike most other plants, soy contains considerable amounts of all the nine amino acids that are essential to humans but which the human body cannot make, and the digestibility of this protein is also high (i.e. the human body is able to take up and use it). Many plants, including raw soybeans, contain antinutritional factors that impede nutrient uptakes but in the case of soy most of these are broken down when they are cooked18 ,19 ,20 . Depending on the protein quality evaluation method that is used, soy scores similarly to animal-based protein sources21 ,22 ,23 .
An added benefit of soy is that, being a legume, it can fix nitrogen from the atmosphere via its root system’s symbiotic relationship with nitrogen-fixating soil bacteria. As with other leguminous plants, because of this ability to biologically fix its own nitrogen, soy can grow on relatively poor soils and is less fertiliser-dependent than many other crops: the global average nitrogen fertiliser application rate for soybean is 4 kg/t yield, compared to 26 kg/t for wheat and 18 kg/t for maize1 ,24 .
3. What has driven the global increase in soy production?
The growth of soy and its use for crushing has, historically, been driven by several factors. Soy – like many other cereals and oilseeds – is suited to large-scale and mechanised production, and its non-perishable nature allows it to be farmed in remote locations and then traded on the global commodity market. The 1996 introduction of glyphosate-tolerant genetically modified (GM) soy facilitated further reductions in labour and machinery inputs through the combination of broad spectrum herbicides (e.g. Roundup) and zero-tillage farming 25 . The combination of glyphosate and GM soy has also aided the expansion of soy onto (degraded) pastures and other areas with native vegetation where weed levels are high25 .
In the first half of the 20th century, US farmers and plant scientists found that soy cake made an excellent protein ingredient for compound feed, used to increase livestock productivity5 ,26 ,27 . The oil derived from crushing soybeans catered to food manufacturing industry’s emerging demand for vegetable oil5 . During the late 1990s and early 2000s, the livestock sector’s use of soy cake was further boosted by the ban on the feed use of bone meal following the outbreak of BSE. This fuelled the sector’s need for cheap plant proteins28 .
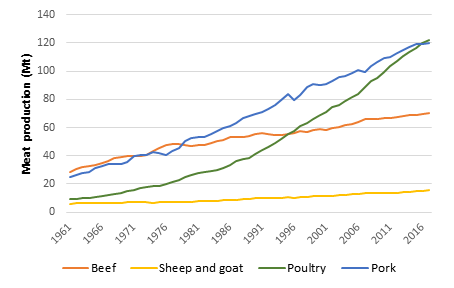
There is some discussion as to the extent to which increases in the production of soy have been driven by the demand for animal feed or food for human consumption29 ,30 ,31 . On a weight basis, most of the global soy output is used for animal feed (about 75%); much less is used for human consumption as either whole beans, meal or oil (20%) and biofuel or other industrial purposes (5%)9 . The growth in the production of soy and its use for crushing also mirrors the strong increase in animal production (especially pig and poultry – see Figure 6) since the 1960s27 ,32 ,33 .
An argument could be made, however, that increases in the production of soy have primarily been driven not by the demand for animal feed, but by the demand for soy oil for human consumption. One might view soy cake as only a by-product of the production of soy oil, as its economic value is much lower (a kilogram of soy oil is about twice the value of a kilogram of soy cake). However, since the crushing of soybeans produces much less oil (20% by weight) than cake (80%), only a third of the overall value of a kilogram crushed soybeans is derived from the oil, as compared with two thirds from the cake8 ,31 . Soy oil is also one of the cheapest vegetable oils on the commodity market, whereas soy cake is the most valuable of all oilseed cakes due to its favourable amino acid profile and the low levels of anti-nutritive compounds it contains after heat treatment34 ,35 .
It is therefore likely that the growth in soy production has primarily been driven by the demand of soy cake for feed, and hence by the growing demand for animal-based products. However, because the oil and the cake originate from the same bean, there is a mutual and economically convenient dependency between their uses. The rapid expansion of soy and its use for feed is therefore likely to have been facilitated by concurrent increases in the demand for vegetable oil31 .
4. Soybean production and deforestation in South America
The vast increase in South America’s soy output is a consequence both of increases in yield (i.e. productivity) and in the area planted with soy. However, the latter is far more significant than the former: while soybean yields have multiplied about 2.5 to 3 times since the early 1960s, the amount of land used to grow soy in South America increased by more than 200 times from 0.26 Mha in 1961 to 57.08 Mha in 20171 . This has been, and continues to be, an important cause of loss of native vegetation.
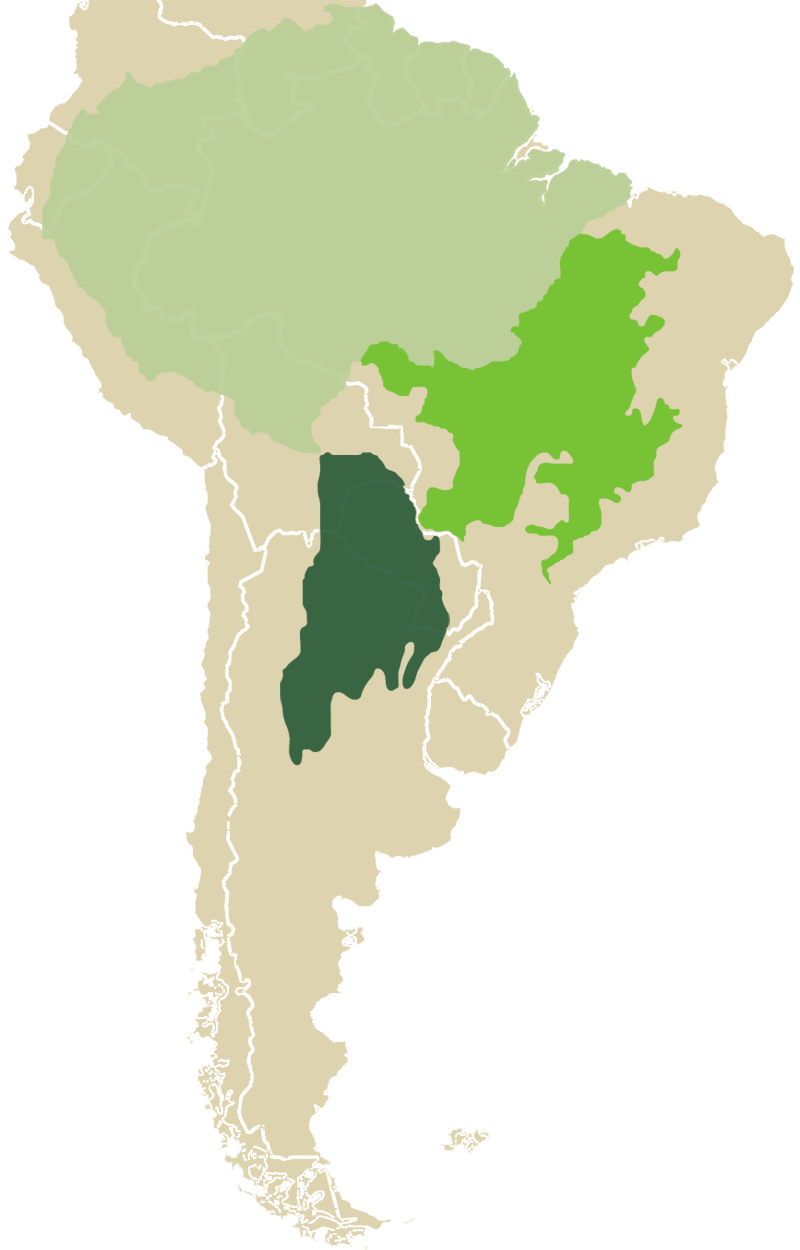
Historically, most attention has been paid to deforestation in the Brazilian Amazon36 ,37 , but there is increasing concern about land use change in other areas such as the Brazilian Cerrado and the Gran Chaco region in Argentina and Paraguay (Figure 7). While the savannas and woodlands of the Cerrado and Gran Chaco are less protected by legislation on deforestation, they too support high biodiversity levels, are major carbon sinks , and provide important ecosystem services (e.g. the Cerrado and parts of the Gran Chaco are home to one of the largest aquifers on earth)6 ,38 ,39 ,40 ,41 .
4.1 Is soy a driver of land use change in South America?
In a direct sense, soy expansion in Brazil, Argentina and Paraguay is responsible for only a part of the total loss of native vegetation6 ,43 ,44 ,45 . A common pattern, however, is that land is first cleared for cattle ranching and shortly afterwards sold or rented out at a higher price for more lucrative soy production6 ,43 ,44 ,45 ,46 . Soy expansion, accordingly, may indirectly bring about land use change by ‘pushing’ cattle ranching into frontier areas6 ,47 ,48 ,49 . The arrival of a high-value crop such as soy can also drive up local land prices and thereby incentivise the clearing of surrounding land6 .
A 2018 report by Trase6 estimated that 40% (1.8 Mha) and 20% (3.5 Mha) of the areas in the Amazon and Cerrado, respectively, on which soy was grown in 2015, were still under native vegetation in 2000. In other words, in 15 years, these areas have gone from native vegetation to soy production, irrespective of whether they were used for other purposes in the meantime. This figure does not give a precise estimation of soy’s role as a driver of land use change, but it does indicate that the transformation of land from native vegetation to soy production is a relatively rapid process that occurs at a large scale, and shows that the demand for soy plays an important role.
4.2 What drives soy expansion in South America?
In line with the uses of soy globally (Figure 3), the greatest driver underlying the production increase in South America is most likely the pig and poultry industry’s demand for soy cake, although it is given additional impetus by concurrent increases in the demand for soy oil by the food manufacturing and biofuel industries (see section 3).
In the period 2000-2017, about 25% of the production volume of South American soy was used domestically, while the EU and China were major export regions7 ,50 ,51 . On a weight basis, most of South America’s domestic soy was consumed as animal feed, but a considerable amount of the animal products produced went for export (for instance, in 2017, respectively 30% and 10% of Brazil’s chicken meat and pork production were for exports7 ). In 2017, roughly 33% of the South American soy production volume went to China (mostly whole beans used for crushing – 64% of China’s total soy imports) and 15% to Europe (mostly soy cake – 60% of its soy imports)1 ,51 . As almost all South American soy is GM52 52, it is unlikely that in the EU much of this is used for human food. The EU requires that food labels list the use of authorised GM ingredients such as GM soy, the result of which has been that little (but still some) GM soy is used for food in the EU.
4.3 Mitigation of soy-related land use change
The fact that much of the South American soy is exported to China and Europe where it is mostly (measured by weight) used to produce pig and poultry products9 , has triggered debate as to the environmental impacts of these foods. In Europe, advocates for plant-based diets sometimes argue that those who eat animal products bear responsibility for deforestation in the Amazon through their consumption of pork, poultry, and – to lesser extent – dairy products. One of the arguments used in support of this claim is that, in the EU, South American soy is an important animal feed but unlikely to be used much for food (see section 4.2). The European feed industry, however, emphasises that significant efforts are made to decouple soy production from deforestation in South America through the Brazilian Soy Moratorium and various certification schemes. Critics argue that in fact these efforts are in a very early stage as, so far, uptake of soy certification has been very low (about 22% of the EU’s soy imports and roughly 0.2-6% worldwide is under some form of certification53 ,54 ), while progress that has been made via the Soy Moratorium has been offset by land use change elsewhere.
4.3.1 The Soy Moratorium
The Soy Moratorium is an important measure aiming to limit further clearing of native vegetation in the Brazilian Amazon. The Moratorium was established in 2006 after the NGO Greenpeace (one of the Moratorium’s initiators) had released an influential report linking Amazonian deforestation to three US traders and the European feed industry55 . The Moratorium was signed by all soy traders who are members of The Brazilian Association of the Vegetable Oil Industry (ABIOVE) or the Brazilian Association of Cereal Exporters (ANEC); together these cover around 90% of the soy exports from the Amazon. These signatories were joined in 2008 by the Brazilian Government56 . Initially renewed year by year, the Moratorium was extended in 2016 for an indefinite period.
Under the terms of the Moratorium, signatory traders commit to not purchase soy grown on Brazilian Amazon lands cleared after a specified cut-off date. Initially, this date was set on July 2006, but following on adjustments in Brazil’s new Forest Code (a piece of legislation on land management), the reference date was changed to July 2008 in 201257 . Importantly, the Moratorium only covers deforestation that is directly linked to soy. There are cases where further deforestation in the Brazilian Amazon is nevertheless compliant with the Forest Code since this allows farmers to clear up to 20% of their land holdings in the Amazon58 . This kind of deforestation falls outside the scope of the Moratorium provided that no soy is grown on the deforested lands.
Traders’ compliance with the Moratorium has been high, and the Moratorium has been credited with reducing the rate of deforestation in the Amazon6 ,59 . Estimations by Brazil’s space agency INPE60 , show that in the years after the introduction of the Moratorium, overall deforestation in the Brazilian Amazon has fallen to about a third the rate before the Moratorium. Conservation scientists, however, note that the Moratorium is likely to have contributed to only a part of this change, as direct deforestation for soy has ever accounted for only a part of overall deforestation6 ,56 . That said, direct deforestation for soy in the Amazon had reduced to nearly zero in 201439 . Nonetheless, the overall acreage under soy has increased significantly since the Moratorium, which has been possible by the conversion of (pasture) land that had already been cleared39 ,56 ,57 ,61 .
Since 2012, overall deforestation in the Amazon has risen again, though it remains at less than half the rate before the Moratorium62 . In the summer of 2019, deforestation levels were exceptionally high due to an exceptional increase in forest fires60 ,63 ,64 . While these increases in deforestation undermine the progress that has been made since the early 2000s, the extent to which they are linked to soy production is yet unclear.
It is important to note that the Moratorium covers only the Brazilian Amazon. Decreasing deforestation in the Amazon is likely to have been offset by land use change for soy in other areas in Brazil, Argentina and Paraguay38 ,65 . In 2017, a group of Brazilian NGOs released the Cerrado Manifesto, which calls for actions similar to the Amazon Soy Moratorium to be taken for the Cerrado. The Cerrado Manifesto is supported by a wide range of actors from the private sector, including investors and supermarket and fast food chains. Some of the largest soy traders, however, indicate their opposition to a Cerrado moratorium by emphasising the contextual differences between the Amazon and Cerrado. For example, they point out that a Cerrado Moratorium would likely create tensions with local farmers who are in fact legally permitted to clear 65-80% of native vegetation on their land holdings – this in comparison to the situation in the Amazon where they are only permitted to clear 20%56 ,58 ,66 . In addition, in some of the Cerrado's traditional soy producing areas, fewer pastures are located in the vicinity of existing soy farms, complicating the expansion of soy onto pastureland56 ,67 .
4.3.2 Soy certification schemes
Certification schemes, such as those created by the RTRS and ProTerra, are an important way for companies to ensure their supply chain is not linked to deforestation. However, increases in the adoption of certification may not automatically result in less soy-related deforestation across the entire sector. Unlike the Moratorium, certification schemes are not specific to a particular geographic region. Most certified soy is destined for Europe; the Chinese market for certified soy is still very small53 .
Soy certification schemes differ by what land use change they allow under the scheme. The 2019 European Soy Monitor53 , a report commissioned by the Sustainable Trade Initiative (IDH) and the Dutch branch of the International Union for Conservation of Nature (IUCN NL), distinguishes two types of certified soy:
- Responsible soy is soy that is covered by one of 18 certification schemes that meet the European Feed Manufacturer’s Federation’s (FEFAC) criteria for ‘responsible soy’. This includes the requirement that soy should not be produced on land that was illegally deforested after cut-off dates determined by national legislation (e.g. 2008 in Brazil’s national forest code). The European soy monitor estimates that in 2017, 22% of all the soy used in the EU for feed was classed as ‘responsible’.
- Deforestation-free soy refers to soy that is covered by one of eight schemes that the Dutch non-profit Profundo68 has identified, in a report commission by IUCN, as prohibiting the clearing of any type of native vegetation – whether or not deemed legal by national legislation – after a cut-off date of 2008 or May 2009. The European soy monitor estimates that in 2017, 13% of the soy used in the EU for feed was classed as ‘deforestation free’. The volume of responsible soy therefore encompasses that of deforestation-free soy.
The difference between responsible and deforestation-free soy is critical. A 2019 IUCN report69 determined that the amount of land that can be cleared in compliance with national legislation on deforestation would amount to 7 Mha in the Paraguayan Chaco, 10.5 Mha in Argentina, and 88 Mha (± error margin of 6 Mha) in Brazil – around 10% of which is in the Amazon and 40-50% is in the Cerrado58 ,70 (in total this comes down to slightly less than the entire land area of the UK, Norway and Sweden combined).
4.3.3 The limitations of certification
As yet, the global market share of certified soy is still small (estimates range from 0.2%54 to 6%53 depending on which schemes are included). A major part of current soy production area in South America, however, is likely to meet the criteria for deforestation-free certification as 41.4 Mha was already under soy production by 2008 (this grew to 57.1 Mha by 2017)1 . Current uptake of certification is especially low when seen in the light of sustainability targets such as the Amsterdam Declarations (signed by seven European countries) which aim to halt deforestation driven by agricultural commodity trade by no later than 2020. One reason for why the uptake of certification in soy is low may be that the premiums paid to farmers are low71 ,72 . In comparison to coffee or chocolate, upgrades in soy production standards may also be less easily monetised because most soy consumption, embedded as it is in foods such as chicken and pork, is ‘invisible’ to end-consumers61 .
The low uptake of certification means that a trader with a share of deforestation-free soy of, say, 20-30% of its overall trade volume, could still be linked to relatively more deforestation than a trader buying only uncertified soy, but from areas that have seen little recent deforestation. In line with this, the 2018 Trase report6 and a later journal article56 , found that zero-deforestation commitments made by a number of European countries and several of the biggest soy traders have not yet reduced the likely amount of deforestation to which their overall soy imports are linked.
Even if some countries were only to source deforestation-free soy, there is the risk of this being offset by other countries simply sourcing more deforestation-linked soy. This is even more likely as many of the largest soy traders supply to both regions with weaker and with stronger current preferences for certified soy (e.g. China and the EU respectively). This is an important difference between soy certification schemes and the Soy Moratorium, with the success of the latter likely to originate from its comprehensiveness (its signatories are responsible for 90% of all the soy exports from the Amazon).
A further limitation of certification in countering land use change is that compliance is easier to achieve for farmers who farm in favourable locations (i.e. where land had already been cleared before 2008) whereas farmers who farm land that was cleared after 2008 are unlikely to join73 .
4.3.4 International trade dynamics
International trade dynamics may affect sourcing patterns and thereby land use change. Conservation scientists are concerned that the US-China trade war, which started in 2018, may cause a surge of deforestation in Brazil49 . In 2018, the United States introduced import tariffs on a range of Chinese products, to which China responded by imposing tariffs on a range of US goods including soy. Following this, China reduced its US soy imports from 29.6 Mt in 2017-2018 to 6.67 Mt in 2018-2019 while its Brazilian imports increased from 55.2 Mt to 65.9 Mt74 ,75 . The EU more than doubled its US imports over the same period (from 4.2 Mt to 9.6 Mt), while it lowered its Brazilian imports by about 1 Mt76 ,77 – which therefore did not compensate for China’s increase.
5. What does this mean for discussions about animal- and plant-based protein sources?
There is broad consensus in the food sustainability movement on the need to prevent the further loss of native vegetation in South America, but perspectives differ as to what changes regarding soy will be needed.
Advocates for more plant-based diets and some supporters of ruminant farming tend to point out that deforestation and land use change in South America can be ascribed to a higher demand for pig and poultry products. It is important to note, however, that soy is not only used for animal feed, but also in the production of processed foods – albeit to a far lesser extent. While South American soy oil is mostly GM and therefore unlikely to be used by the European food industry, processed foods in South America and China (amongst others) may contain Brazilian or Argentinian soy oil.
Initiatives to reduce deforestation, such as certification schemes and the Amazon Soy Moratorium, have been embraced by the European pig and poultry industry. However, while these are important first steps, they have not yet led to the decoupling of soy production from land use change in South America. Globally, only 0.2-6% of the soy production volume is covered by some form of certification. Furthermore, even were some countries to stop buying uncertified soy, this might not automatically lead to a reduction in overall land use change. The knock-on effect of such a measure might be that other countries simply increase their purchase of soy produced on recently cleared land. Another possible way of reducing soy-related land use change is for the livestock sector to reduce its dependency on soy by increasing its use of food waste, or by adopting alternative protein meals, such as ones based on insects (e.g. the black soldier fly) or algae. Research into the feasibility and environmental impacts of such alternatives is ongoing78 ,79 .
Advocates for more plant-based diets argue that the soy that is currently fed to animals could also be eaten by humans directly. By bypassing the animal, they point out, less soy would need to be grown to produce the same amount of food and nutrients (e.g. kg protein). This could potentially free up land for nature conservation. The amount of land that could potentially be freed up this way depends on factors such as feed conversion rates and the quality of plant- versus animal-based proteins (see our building block on feed-food competition) as well as on economic and political factors which will determine how any land released actually ends up being used. A more fundamental question, however, is whether it is possible to shift our consumption patterns away from eating pig and poultry products towards alternatives – whether based on soy, algae, insects or anything else.
Pertaining to soy, it is important to consider what soy foods people may be willing to consume in different regions of the world, and the soy varieties required to make them. All soy is edible by humans in principle, but, in practice, the food industry uses soy cultivars with specific properties (e.g. colour, size, taste or protein content) for whole bean-based foods such as tofu, tempeh and soymilk80 ,81 ,82 ,83 . The use of regular commodity soy could affect the taste and appearance of the food products52 , and potentially make them more difficult to sell. As yet, research into the acceptability of commodity soy for human consumption is lacking. While land currently used to grow commodity soy might be used to farm food-grade soy, this conversion may not work equally well depending on the context (e.g. climate) and cultivars. Whereas the soy used for tofu and soymilk provides yield levels similar to commodity soy, edamame soybeans are farmed at lower crop densities and require more energy and labour during crop handling, harvesting, storage and transport83 ,84 ,85 . That said, this would likely be outweighed by efficiency increases in the provision of nutrients (e.g. amount of inputs used per kg protein) since the soy is being consumed by humans directly, i.e. without the intermediate step of animal production.
Another way forward is to use the oil and cake derived from crushing commodity soybeans to produce processed foods and meat alternatives. Currently, less than 1% of all soy cake is used for food, for example in plant-based burgers with textured soy protein as their main ingredient. (Note that most soy cake is of GM origin and may not be approved for food use everywhere.) The use of soy cake for food links soy to discussions about ultra-processed foods (UPFs) and their health impacts. Fundamentally, this debate concerns different perspectives on the role of the food industry in determining what it is we eat. To critics of UPFs, the use of soy cake for food instead of for feed does not address the way the globalised food system is operated and controlled by large multinationals that foster the monocultural production of GM soy on deforested lands, all of which results in the manufacturing of foods they consider to be unhealthy, whether processed meats or plant-based UPFs.
Discussions on the environmental impacts of soy and its links to land use change, accordingly, centre on three interrelated questions that are at the heart of the wider debate on food, sustainability, and future protein sources:
- Is it possible or necessary for (some part of) human demand to switch from pig and poultry to a diversity of (plant-based) alternatives? And if so, how might this be achieved?
- What is the role of UPFs versus more traditional foods in a sustainable and healthy diet?
- What approaches to farming and what role for large multinationals (if any) characterise a more sustainable global food system?
More research will be needed to provide rigorous answers to these questions, but it is important to consider that people will answer them differently depending on how they view and value the different issues.
Download the PDF version of this explainer here.
Footnotes
- 1 a b c d e f g Food and Agriculture Organization of the United Nations. Crops. FAOSTAT (n.d.). Available at: http://www.fao.org/faostat/en/#data/QC/visualize. (Accessed: 9th July 2019)
- 2Food and Agriculture Organization of the United Nations. Value of Agricultural Production . FAOSTAT (n.d.). Available at: http://www.fao.org/faostat/en/#data/QV. (Accessed: 6th December 2019)
- 3 a b c d e f United States Department of Agriculture. PSD Online. (n.d.). Available at: https://apps.fas.usda.gov/psdonline/app/index.html#/app/advQuery. (Accessed: 5th November 2019)
- 4Hymowitz, T. On the domestication of the soybean. Economic Botany 24, 408–421 (1970). doi:10.1007/BF02860745
- 5 a b c Shurtleff, W. & Aoyagi, A. History of World Soybean Production and Trade - Part 1. in History of Soybeans and Soyfoods, 1100 B.C. to the 1980s (Soyfoods Center, 2004).
- 6 a b c d e f g h i j West, C. D., Green, J. M. H. & Croft, S. Trase Yearbook 2018: Sustainability in forest-risk supply chains: Spotlight on Brazilian soy. 69 (Stockholm Environment Institute, 2018).
- 7 a b c d Food and Agriculture Organization of the United Nations. Food Balance Sheets. FAOSTAT (n.d.). Available at: http://www.fao.org/faostat/en/#data/FBS. (Accessed: 17th July 2019)
- 8 a b United States Department of Agriculture. Oilseeds: World markets and trade. (2017).
- 9 a b c United Soybean Board. Supply & Disappearance. USB Market View Database (n.d.). Available at: https://marketviewdb.centrec.com/sd/. (Accessed: 2nd August 2019)
- 10United States Department of Agriculture. Brazil Biofuels Annual 2018. (2018).
- 11United States Department of Agriculture. Argentina Biofuels Annual 2018. (2018).
- 12United States Department of Agriculture. China Biofuels Annual 2019. (2019).
- 13United States Department of Agriculture. India Biofuels Annual 2019. (2019).
- 14United States Department of Agriculture. Canada Biofuels Annual 2019. (2019).
- 15United States Department of Agriculture. Paraguay Biofuels Annual 2015. (2015).
- 16 a b Pinchen, H., Powell, N., Weiner, D. & Finglas, P. Composition of foods integrated dataset (CoFID). gov.uk (2019). Available at: https://www.gov.uk/government/publications/composition-of-foods-integrated-dataset-cofid. (Accessed: 6th November 2019)
- 17 a b United States Department of Agriculture. FoodData Central. (n.d.). Available at: https://fdc.nal.usda.gov/fdc-app.html#/. (Accessed: 6th November 2019)
- 18Gemede, H. F. & Ratta, N. Antinutritional factors in plant foods: Potential health benefits and adverse effects. International Journal of Nutrition and Food Sciences 3, 284–289 (2014). doi:10.11648/j.ijnfs.20140304.18
- 19Khokhar, S. & Apenten, R. K. O. Antinutritional Factors in Food Legumes and Effects of processing. in The role of food, agriculture, forestry and fisheries in human nutrition 82–116 (Encyclopedia of Life Support Systems, 2003).
- 20Liener, I. E. Implications of antinutritional components in soybean foods. Critical Reviews in Food Science and Nutrition 34, 31–67 (1994). doi:10.1080/10408399409527649
- 21Mathai, J. K., Liu, Y. & Stein, H. H. Values for digestible indispensable amino acid scores (DIAAS) for some dairy and plant proteins may better describe protein quality than values calculated using the concept for protein digestibility-corrected amino acid scores (PDCAAS). British Journal of Nutrition 117, 490–499 (2017). doi:10.1017/S0007114517000125
- 22Ertl, P., Knaus, W. & Zollitsch, W. An approach to including protein quality when assessing the net contribution of livestock to human food supply. Animal 10, 1883–1889 (2016). doi:10.1017/S1751731116000902
- 23Food and Agriculture Organization of the United Nations. Dietary protein quality evaluation in human nutrition: report of an FAO expert consultation, 31 March-2 April, 2011, Auckland, New Zealand. (Food and Agriculture Organization of the United Nations, 2013).
- 24Heffer, P., Gruère, A. & Roberts, T. Assessment of Fertilizer Use by Crop at the Global Level - 2014-2014/15. (International Fertilizer Association and International Plant Nutrition Institute, 2017).
- 25 a b Bindraban, P. S. et al. GM-related sustainability: agro-ecological impacts, risk and opportunities of soy production in Argentina and Brazil. (Plant Research International, 2009).
- 26Hymowitz, T. Soybeans: The Success Story. in Advances in New Crops (eds. Janick, J. & Simon, J.) (Timber Press, 1990).
- 27 a b Coffey, D., Dawson, K., Ferket, P. & Connolly, A. Review of the feed industry from a historical perspective and implications for its future. Journal of Applied Animal Nutrition 4, (2016). doi:10.1017/jan.2015.11
- 28Ducrot, C., Paul, M. & Calavas, D. BSE risk and the use of meat and bone meal in the feed industry: perspectives in the context of relaxing control measures. Natures Sciences Sociétés 21, 3–12 (2013). doi:10.1051/nss/2013063
- 29Flipsen, H. Veroorzaakt de Nederlandse vlees-, zuivel- en eierproductie ontbossing van het Amazone-gebied? Foodlog (2019). Available at: https://www.foodlog.nl/artikel/zorgt-de-nederlandse-vlees-zuivel-en-eierproductie-voor-ontbossing-van/. (Accessed: 12th April 2019)
- 30Irwin, S. The Value of Soybean Oil in the Soybean Crush: Further Evidence on the Impact of the U.S. Biodiesel Boom. farmdoc daily (2017). Available at: https://farmdocdaily.illinois.edu/2017/09/the-value-of-soybean-oil-in-the-soybean-crush.html. (Accessed: 12th April 2019)
- 31 a b c Garnett, T. Meat and Dairy Production & Consumption: Exploring the livestock sector’s contribution to the UK’s greenhouse gas emissions and assessing what less greenhouse gas intensive systems of production and consumption might look like. 169 (Centre for Environmental Strategy, University of Surrey, 2007).
- 32Pica-Ciamarra, U. & Otte, J. The ‘Livestock Revolution’: Rhetoric and Reality. Outlook on Agriculture 40, 7–19 (2011). doi:10.5367/oa.2011.0030
- 33 a b FAO . FAOSTAT Livestock Primary. Livestock Primary (n.d.). Available at: http://www.fao.org/faostat/en/#data/QL. (Accessed: 4th November 2019)
- 34Woyengo, T. A., Beltranena, E. & Zijlstra, R. T. Effect of anti-nutritional factors of oilseed co-products on feed intake of pigs and poultry. Animal Feed Science and Technology 233, 76–86 (2017). doi:10.1016/j.anifeedsci.2016.05.006
- 35Ravindran, V. & Blair, R. Feed resources for poultry production in Asia and the Pacific. II. Plant protein sources. World’s Poultry Science Journal 48, 205–231 (1992). doi:10.1079/WPS19920017
- 36Sauer, S. Soy expansion into the agricultural frontiers of the Brazilian Amazon: The agribusiness economy and its social and environmental conflicts. Land Use Policy 79, 326–338 (2018). doi:10.1016/j.landusepol.2018.08.030
- 37Garrett, R. D. & Rausch, L. L. Green for gold: social and ecological tradeoffs influencing the sustainability of the Brazilian soy industry. The Journal of Peasant Studies 43, 461–493 (2016). doi:10.1080/03066150.2015.1010077
- 38 a b Lahsen, M., Bustamante, M. M. C. & Dalla-Nora, E. L. Undervaluing and Overexploiting the Brazilian Cerrado at Our Peril. Environment: Science and Policy for Sustainable Development 58, 4–15 (2016). doi:10.1080/00139157.2016.1229537
- 39 a b c Gibbs, H. K. et al. Brazil’s Soy Moratorium . Science 347, 377–378 (2015). doi:10.1126/science.aaa0181
- 40Redford, K. H., Taber, A. & Simonetti, J. A. There is More to Biodiversity than the Tropical Rain Forests. Conservation Biology 4, 328–330 (1990). doi:10.1111/j.1523-1739.1990.tb00296.x
- 41Soterroni, A. C. et al. Expanding the Soy Moratorium to Brazil’s Cerrado. Science Advances 5, 1-9 (2019). doi:10.1126/sciadv.aav7336
- 42World Wildlife Fund. What are the biggest drivers of tropical deforestation? World Wildlife Fund (2018). Available at: https://www.worldwildlife.org/magazine/issues/summer-2018/articles/what-are-the-biggest-drivers-of-tropical-deforestation. (Accessed: 11th October 2019)
- 43 a b Gollnow, F., Hissa, L. de B. V., Rufin, P. & Lakes, T. Property-level direct and indirect deforestation for soybean production in the Amazon region of Mato Grosso, Brazil. Land Use Policy 78, 377–385 (2018). doi:10.1016/j.landusepol.2018.07.010
- 44 a b Gollnow, F. & Lakes, T. Policy change, land use, and agriculture: The case of soy production and cattle ranching in Brazil, 2001–2012. Applied Geography 55, 203–211 (2014). doi:10.1016/j.apgeog.2014.09.003
- 45 a b Fehlenberg, V. et al. The role of soybean production as an underlying driver of deforestation in the South American Chaco. Global Environmental Change 45, 24–34 (2017). doi:10.1016/j.gloenvcha.2017.05.001
- 46Richards, P. D., Walker, R. T. & Arima, E. Y. Spatially complex land change: The Indirect effect of Brazil’s agricultural sector on land use in Amazonia. Global Environmental Change 29, 1–9 (2014). doi:10.1016/j.gloenvcha.2014.06.011
- 47Barona, E., Ramankutty, N., Hyman, G. & Coomes, O. T. The role of pasture and soybean in deforestation of the Brazilian Amazon. Environ. Res. Lett. 5, 024002 (2010). doi:10.1088/1748-9326/5/2/024002
- 48Gasparri, N. I. & Waroux, Y. le P. de. The Coupling of South American Soybean and Cattle Production Frontiers: New Challenges for Conservation Policy and Land Change Science. Conservation Letters 8, 290–298 (2015). doi:10.1111/conl.12121
- 49 a b Fuchs, R. et al. US-China trade war imperils Amazon rainforest. (Nature, 2019).
- 50FAO. Trade - Crops and livestock products. Available at: http://www.fao.org/faostat/en/#data/TP. (Accessed: 5th August 2019)
- 51 a b Chatham House. Exploring interdependencies in global resource trade. resourcetrade.earth (n.d.). Available at: https://resourcetrade.earth/. (Accessed: 13th September 2019)
- 52 a b International Service for the Acquisition of Agri-biotech Applications. Global Status of Commercialized Biotech/GM Crops in 2017: Biotech Crop Adoption Surges as Economic Benefits Accumulate in 22 Years. (ISAAA, 2017).
- 53 a b c d Kuepper, B. & Riemersma, M. European Soy Monitor - Insights on the European supply chain and the use of responsible and deforestation-free soy in 2017. (IDH and IUCN NL, 2019).
- 54 a b Tayleur, C. et al. Where are commodity crops certified, and what does it mean for conservation and poverty alleviation? Biological Conservation 217, 36–46 (2018). doi:10.1016/j.biocon.2017.09.024
- 55Greenpeace. Eating up the Amazon. (Greenpeace International, 2006).
- 56 a b c d e f Ermgassen, E. K. H. J. zu et al. Using supply chain data to monitor zero deforestation commitments: an assessment of progress in the Brazilian soy sector. Environmental Research Letters (2019). doi:10.1088/1748-9326/ab6497
- 57 a b Mantelatto, P., Jordão, M., Nunes, F. & Silva, D. 10-year of soy moratorium in the Amazon: History, Impacts and Expansion into Cerrado areas. 68 (Institute of Agricultural and Forest Management and Certification – Imaflora, 2016).
- 58 a b c Soares-Filho, B. et al. Cracking Brazil’s Forest Code. Science 344, 363–364 (2014). doi:10.1126/science.1246663
- 59Kastens, J. H., Brown, J. C., Coutinho, A. C., Bishop, C. R. & Esquerdo, J. C. D. M. Soy moratorium impacts on soybean and deforestation dynamics in Mato Grosso, Brazil. Plos one 12, e0176168 (2017). doi:10.1371/journal.pone.0176168
- 60 a b Instituto Nacional de Pesquisas Espaciais. TerraBrasilis. (n.d.). Available at: http://terrabrasilis.dpi.inpe.br/app/dashboard/deforestation/biomes/legal_amazon/rates. (Accessed: 10th September 2019)
- 61 a b Rausch, L. L. & Gibbs, H. K. Property Arrangements and Soy Governance in the Brazilian State of Mato Grosso: Implications for Deforestation-Free Production. Land 5, 7 (2016). doi:10.3390/land5020007
- 62Mongabay. Calculating Deforestation in the Amazon. Mongabay Available at: https://rainforests.mongabay.com/amazon/deforestation_calculations.html. (Accessed: 27th January 2020)
- 63Instituto Nacional de Pesquisas Espaciais. Alertas do DETER na Amazônia em junho somam 2.072,03 km2. (2019). Available at: http://www.inpe.br/noticias/noticia.php?Cod_Noticia=5147.
- 64Barlow, J., Berenguer, E., Carmenta, R. & França, F. Clarifying Amazonia’s burning crisis. Global Change Biology 1-3 (2019) doi:10.1111/gcb.14872
- 65le Polain de Waroux, Y. et al. The Restructuring of South American Soy and Beef Production and Trade Under Changing Environmental Regulations. World Development 121, 188–202 (2019). doi:10.1016/j.worlddev.2017.05.034
- 66Yaffe-Bellany, D. From Environmental Leader to ‘Worst Company in the World’. The New York Times (2019). Available at: https://www.nytimes.com/2019/07/29/business/brazil-deforestation-cargill.html. (Accessed: 26th November 2019)
- 67Nepstad, L. S. et al. Pathways for recent Cerrado soybean expansion: extending the soy moratorium and implementing integrated crop livestock systems with soybeans. Environmental Research Letters 14, 044029 (2019). doi:10.1088/1748-9326/aafb85
- 68Kusumaningtyas, R. & van Gelder, J. W. Setting the bar for deforestation-free soy in Europe. 38 (Profundo, 2019).
- 69van Dam, J., van den Hombergh, H. & Hilders, M. An analysis of existing laws on forest protection in the main soy producing countries in Latin America. 44 (IUCN, 2019).
- 70Rausch, L. L. et al. Soy expansion in Brazil’s Cerrado. Conservation Letters 1–10 (2019). doi:10.1111/conl.12671
- 71Lenfert, Z. M. & Börner, J. Soybean certification and tropical deforestation in Brazil: how to move towards zero-net deforestation. 1–11 (Center for Development Research (ZEF), University of Bonn, 2017).
- 72Virah-Sawmy, M. et al. Sustainability gridlock in a global agricultural commodity chain: Reframing the soy–meat food system. Sustainable Production and Consumption 18, 210–223 (2019). doi:10.1016/j.spc.2019.01.003
- 73Lambin, E. F. et al. The role of supply-chain initiatives in reducing deforestation. Nature Climate Change 8, 109–116 (2018). doi:10.1016/S0959-3780(01)00007-3
- 74General Administration of Customs. Home. (n.d.). Available at: http://english.customs.gov.cn/. (Accessed: 18th November 2019)
- 75General Administration of Customs. Customs statistics data query platform. (n.d.). Available at: http://43.248.49.97/indexEn. (Accessed: 18th November 2019)
- 76European Commission. EC - Agri oilseed and protein crops trade data. (n.d.). Available at: https://agridata.ec.europa.eu/extensions/DashboardCereals/OilseedTrade.html?selections=PARTNER_OIL-United%20States%20of%20America$SUBCATEGORY_OIL-Soyabeans$TRADE_OIL-IMPORT$GROUP-Oilseeds,Oilseed%20meals,Oilseed%20oils. (Accessed: 15th November 2019)
- 77European Commission. United States is Europe’s main soya beans supplier with imports up by 112%. European Commission (2019). Available at: https://ec.europa.eu/commission/presscorner/detail/en/IP_19_161. (Accessed: 15th November 2019)
- 78Belghit, I. et al. Black soldier fly larvae meal can replace fish meal in diets of sea-water phase Atlantic salmon (Salmo salar). Aquaculture 503, 609–619 (2019). doi:10.1016/j.aquaculture.2018.12.032
- 79Van Zanten, H. H. E., Bikker, P., Mollenhorst, H., Meerburg, B. G. & de Boer, I. J. M. Environmental impact of replacing soybean meal with rapeseed meal in diets of finishing pigs. Animal 9, 1866–1874 (2015). doi:10.1017/S1751731115001469
- 80MacLeod, G. & Ames, J. Soy flavor and its improvement. Crit Rev Food Sci Nutr 27, 219–400 (1988). doi:10.1080/10408398809527487
- 81Zhang, B. et al. Seed quality attributes of food-grade soybeans from the U.S. and Asia. Euphytica 173, 387–396 (2010). doi:10.1007/s10681-010-0126-y
- 82Hartman, G. L., Pawlowski, M. L., Herman, T. K. & Eastburn, D. Organically Grown Soybean Production in the USA: Constraints and Management of Pathogens and Insect Pests. Agronomy 6, 16 (2016). doi:10.3390/agronomy6010016
- 83 a b Lee, C. & Herbek, J. AGR-182: Specialty Soybean Production. 6 (University of Kentucky, n.d.).
- 84Wang, H. L., Swain, E. W., Kwolek, W. F. & Fehr, W. R. Effect of soybean varieties on the yield and quality of tofu. (1983). doi:10113/26009
- 85Rao, M. S. S. et al. Genotype × Environment Interactions and Yield Stability of Food-Grade Soybean Genotypes. Agronomy Journal 94, 72–80 (2002). doi:10.2134/agronj2002.7200
Recommended resources
To learn more about soy, deforestation, and the connections to discussions on animal- and plant-based proteins, we recommend the following resources:
- Journal article (open access): Ermgassen, E. K. H. J. zu et al. Using supply chain data to monitor zero deforestation commitments: an assessment of progress in the Brazilian soy sector. Environmental Research Letters (2019). doi:10.1088/1748-9326/ab6497
- Journal article (open access): Gibbs, H. K. et al. Brazil’s Soy Moratorium. Science 347, 377–378 (2015). doi:10.1126/science.aaa0181
- The Transparency for Sustainable Economies (Trase) platform
- The global resource trade platform by Chatham House: resource trade
- Report: Kuepper, B. & Riemersma, M. European Soy Monitor - Insights on the European supply chain and the use of responsible and deforestation-free soy in 2017. (IDH and IUCN NL, 2019).
Acknowledgements
Suggested citation
Fraanje, W. & Garnett, T. (2020). Soy: food, feed, and land use change. (Foodsource: Building Blocks). Food Climate Research Network, University of Oxford.
DOI:
https://doi.org/10.56661/47e58c32
Written by
- Walter Fraanje, Food Climate Research Network, University of Oxford
- Tara Garnett, Food Climate Research Network, University of Oxford
Edited by
- Helen Breewood, Food Climate Research Network, University of Oxford
Reviewed by
- Dr Erasmus zu Ermgassen, Earth and Life Institute, the Catholic University of Leuven
- Dr Florian Gollnow, National Socio-Environmental Synthesis Center, University of Maryland
- Mollie Gupta, Forest Commodities Manager, World Wildlife Fund, United Kingdom
- Professor Mike Hamm, Center for Regional Food Systems, Michigan State University
- Barbara Kuepper, Senior researcher Sustainable Supply Chains, Profundo
Reviewing and advising do not constitute an endorsement. Final editorial decisions, including any remaining inaccuracies and errors, are the sole responsibility of the Food Climate Research Network.
Funded by
- The Daniel and Nina Carasso Foundation
- The Oxford Martin School
- The Wellcome Trust, Our Planet Our Health (Livestock, Environment and People - LEAP), award number 205212/Z/16/Z


Post a new comment »